Proppant intensity may increase by 35% in Permian Basin before reaching optimal economics
North American operators likely to continue pursuing aggressive completion designs, push proppant loading intensity in order to maximize well productivity
By Ryan Peacock, Brandon Stackhouse and Purav Patel, McKinsey Energy Insights
To maximize well productivity in the current low oil-price environment, operators in North America have adjusted their completion designs and substantially increased their proppant use. At $50 oil prices, that trend is expected to continue – particularly in the Permian, where our analysis indicates that proppant intensity will rise by 35% before reaching optimal economics. The resulting increase in North American demand – up from 45 million tons in 2016 to 110 million tons in 2018 – will be a boon for suppliers and a key driver of low-cost sand flooding into the Permian.
Finding the sweet spot
The length and severity of the downturn has forced operators to find new ways to increase production. Among North American E&Ps, two primary methods have emerged: confining drilling to top-tier acreage and introducing more aggressive completion designs for new wells (Figure 1). Since implementing these practices, operators have realized annual productivity increases of 15%, up to an average 30-day initial production (IP) rate of 3,800 bbl per 1,000 lateral ft. Based on these observed IP increases, we anticipate that North American shale basins can sustain a 10% to 35% increase in proppant loading intensity before becoming uneconomic at an oil price of $50/bbl.

Each basin’s relationship between proppant intensity and IP is different, and for each basin there is a point at which the net present value (NPV) is reached, and pumping additional sand into a well becomes uneconomic. However, identifying where this sweet spot exists is not straightforward. As an example, we’ve analyzed the different optimal points for two North American unconventional plays – the Bakken Basin and the Delaware-Wolfcamp sub-play of the Permian Basin – by examining the impact of increasing proppant intensity on NPV.
Bakken proppant intensity
The Bakken was one of the first shale plays where operators began extensively applying unconventional drilling techniques, so operators have been able to use several years’ worth of data to inform their decisions regarding lateral lengths and proppant loading intensities. Completions data from the first half of 2017 indicates that while lateral lengths have changed relatively little over the past year, operators have continued to push the limits on proppant intensities. In fact, average loading has increased from approximately 800 lb/ft in 2016 to nearly 1,000 lb/ft as of mid-2017.

By performing a sensitivity analysis on proppant intensity, we can see that operators in the Bakken have limited growth potential from current intensity levels before the incremental pound of proppant negatively impacts NPV – observed at approximately 1,100 lb/ft (Figure 2). Given the speed at which proppant usage is increasing in the basin, the Bakken may reach this point as soon as mid-2018, after which additional moves toward higher proppant intensities will likely diminish the value of the well.
Although this NPV analysis is based on average proppant intensities and well productivity characteristics for the entire basin, the Bakken appears to be quickly approaching a limit to its proppant intensity levels. As a result, per-well proppant demand will likely be stable in the basin unless major technological changes occur.
Permian proppant intensity
The Permian basin provides a contrasting example of how an unconventional play may evolve. Characterized by strong growth and low breakeven prices, the Permian has experienced rapid changes in well design as operators test ever-greater proppant volumes in the Midland and Delaware sub-plays. Since 2014, proppant volume per well in this region has more than doubled as operators began using low-cost local sand in fine grain completions.
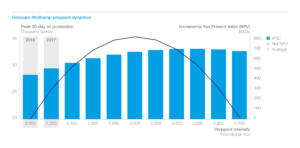
Despite the basin’s strong growth in proppant intensity, the Permian – unlike the Bakken – does not appear to be near its optimal loading potential. For example, the Delaware-Wolfcamp sub-play has an average current proppant loading of nearly 2,000 lb/ft, yet could realize up to a 35% increase in proppant intensity before approaching its sweet spot in NPV (Figure 3).
Supply and logistical challenges
This trend towards greater proppant loading comes as sand suppliers have announced a surge of in-basin supply – more than 40 million tons of local sand capacity has been announced. And while it would initially appear that an increase of this magnitude would result in chronic oversupply, we’re expecting Permian proppant demand to increase from 13 million tons in 2016 to 38 million tons in 2018. As a result, we’ll see relatively high utilization rates (approximately 70%) of this cheaper, fit-for-purpose supply. Interestingly, even if the price of proppant increased by 50%, the optimal NPV per basin would not significantly change, indicating the relative resiliency of the “high proppant intensity” trend to pricing.

As with the Bakken, productivity gains achieved by increasing proppant intensity will vary based on the acreage’s position in the Permian and differences in the underlying geology. Nonetheless, signs indicate that the basin will continue to observe sustained growth in proppant demand, benefiting proppant suppliers and service companies in the region.
While there will likely be some supply issues as new supply sources are either constructed or reactivated, supply and demand are broadly projected to match without creating substantial increases in proppant pricing for producers.
Assuming that the projected demand materializes and that supply exists to meet it, there remains two major factors that could create headwinds for the proppant market: transportation logistics and pressure-pumping capacity. Challenges with proppant transportation tend to center around last-mile logistics, as the proppant is moved from a rail station to the wellhead via truck. West Texas roadway infrastructure, in particular, has become progressively more congested as each well requires delivery of several million pounds of sand. Even sourcing enough drivers for all of these trucks has proved difficult.
Similar issues have been observed by companies providing completions services, as the growing rate of drilling over the past year has stretched existing frac crews beyond available capacity. This problem has been exacerbated by the rising volume of sand that each well demands and the additional time it takes to pump these larger volumes. Although both service companies and producers are aware of these issues and are attempting to address them, it is too early to tell how these problems will be solved or if they constitute major bottlenecks for increasing proppant loading and overall demand.
Demand for North American shale oil integral to the global oil supply stack
Provided these concerns can be resolved, there are implications for both the North American proppant market and the global oil market. Demand for proppant will grow in basins like the Permian, which exhibits both strong drilling activity recovery and capacity to increase proppant intensity levels. The need to pump more proppant may put continued upward pricing pressure on completion-related oilfield services, which have already seen 20% to 30% increases in the past year. Even with this potential rise in costs around services, the resulting production gains and increases in well NPV will keep shale oil production profitable at prices of $50/bbl. With the high likelihood of maintaining profitability and competitiveness in a low-price environment, North American shale oil will continue to be a key contributor to the global oil supply stack for the near- to mid-term future.
Methodology: Incremental NPV of a well across proppant loading intensities was determined assuming an oil price of USD 50 per barrel. Basin average lateral lengths were held constant at mid-2017 values. Costs associated with increased proppant usage, such as pressure pumping and water management, increased as a function of proppant volume per well. Proppant cost per ton in each basin was held constant at the mid-2017 basin average across examined completion intensities. IP rates as a function of proppant intensity were determined from historical completions data. DC


