Surface-based pressure analysis demonstrates potential to enable real-time adaptive completions
Permian program validates use of surface pressure data for live frac evaluation, shows promise for predictive modeling applications
By Jessica Whiteside, Contributor
A multi-year technical program in the Permian Basin confirmed that surface-based pressure signal analysis can enable real-time monitoring of fracture behavior during hydraulic fracturing. This shows the potential to adjust operations on the fly and reduce treatment intensity and costs.
ShearFRAC, which specializes in advanced pressure measurement technologies, collaborated with Sabinal Energy (now part of Mach Natural Resources) on the project, which had two interrelated goals. The first was to confirm the validity of surface pressure analysis for evaluating fracture dynamics during active operations to gain real-time insights on the effectiveness of stage-level treatments. The second goal was to apply surface pressure-derived insights to optimize completion designs for subsequent wells.
Surface pressure analysis is a way to monitor what is happening downhole during hydraulic fracturing. Even small changes in pressure can indicate whether a new fracture has occurred and help engineers measure the growth of the fracture network, including potential interaction with offset wells. The real-time nature of surface pressure analysis means crews can flag the need for corrections to factors such as rate or proppant concentration while an operation is under way. The project team aimed to prove the value of surface pressure analysis as a primary diagnostic tool.
Tapping a mature field
The development target was a 1,000-ft-thick interval of waterflooded carbonate in the Middle Clear Fork Formation of the Permian’s Central Basin Platform, a mature field discovered in the 1950s. The project began with the hypothesis that there could be many underswept intervals left within this formation with high remaining oil in place, said Tyler Szilagyi, Technical Account Manager at ShearFRAC. He presented findings from the project at the 2026 SPE Hydraulic Fracturing Technical Conference in The Woodlands, Texas, on 5 February.
Given the maturity of the field, a key driver for the project was to avoid over-stimulation, which could raise the risk of undesirable water breakthrough from previously developed intervals.
“The objective for this project was really to maximize the capital efficiency by drilling and completing the most economically productive wells possible, tailored to those underdeveloped zones within that mature waterflood unit,” Mr Szilagyi said.
The project was executed in several phases from 2021 through 2024. Phase 1 saw initial horizontal wells drilled and completed to confirm the production potential of underswept areas. Phase 2 focused on validating the accuracy of surface pressure analysis against other diagnostic approaches for monitoring fracture behavior. Lessons from this phase were then applied in Phase 3 to develop and implement optimal completion designs for the next set of wells.
Validating the technology
In Phase 2, a pair of 1-mile horizontal wells were drilled from Pad A and completed with a single-point-entry coil-frac system. To monitor pressure variations, the team equipped the wellhead with a pressure transducer.
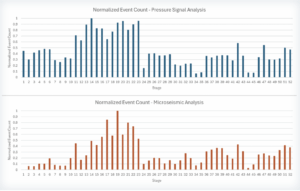
Because a key goal was to validate the performance of surface pressure analysis against other methods for tracking fracture activity, they equipped one of the wells with additional diagnostic tools. These tools typically provide data that is analyzed at the end of an operation. They included high-resolution microseismic arrays for spatial fracture mapping, chemical tracer analysis for fluid placement variation, and geological log interpretation.
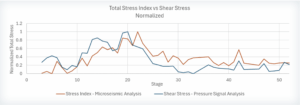
The team’s testing found strong correlations between the surface pressure diagnostics and these other independent measurements with respect to fracture event counts, stress data, production data and other factors. For example, there were strong correlations between normalized event counts and stress data acquired through microseismic arrays and similar data captured through surface pressure analysis, reinforcing the value of these techniques for detecting when fractures occur and quantifying their intensity.
“Through this project, we were able to further validate our diagnostic with very high correlation to microseismic and tracer recovery,” Mr Szilagyi said. “This confirms its reliability as a real-time diagnostic.”
Optimizing design
The team evaluated different completion design combinations across the two Pad A wells, testing a variety of stage spacings, fluid loadings and proppant loadings, as well as some stages with acid-only designs. “We wanted to really understand and evaluate multiple designs, targeting maximum effectiveness for these laterals,” Mr Szilagyi said.
Surface pressure analysis allows engineers to look at pressure through another lens to understand key components that occur during frac operations, such as the frequency of fracturing events and their amplitude or relative size. Since the technology allows these factors to be measured and displayed in real time, it enables teams to better evaluate the effectiveness of each stage and compare one design with the next, Mr Szilagyi said.
Stages with larger volumes of fluid and proppant pumped showed higher total effectiveness – an expected result but one that does not directly equate to improved efficiency, according to the project team. However, they dug deeper into the effectiveness data, normalizing the results by clean fluid volume injected, and determined that designs with less intense treatment achieved similar or greater efficiency with lower injected volumes.
“Since we’re targeting really the economics of these wells, trying to be as efficient as possible, what this allows us to do is take that effectiveness, divide it by the clean volume that we’re injecting into each of these wells, and look for that rollover point where we start to lose some of this effectiveness,” Mr Szilagyi said. “This allowed us to come up with the optimal design for this area, with a medium spacing and some medium fluid and proppant loadings within that design.”
They applied their “best fit” design to two 8,500-ft laterals drilled on Pad B in Phase 3 of the project and succeeded in reducing fluid volumes by 28% and proppant by 30%. Those reductions contributed to lower completion costs relative to earlier phases of the project.
“From Phase 1 to Phase 3, we were able to reduce our completion cost per foot by 60%, which is quite significant. And then even from Phase 2 through to Phase 3, we were able to reduce that completion cost per foot by 30%,” Mr Szilagyi said.
Additionally, cumulative oil production in Phase 3 increased by 28% relative to Phase 2. At the same time, water production dropped by 19%, Mr Szilagyi said, indicating that the refined completion design had helped to minimize interaction with offset injecting wells. Overall, they achieved an 18% reduction in the dollar per barrel of oil equivalent spent on drilling and completing the Pad B wells. Mr Szilagyi credits the surface pressure-derived fracture measurements for helping the team to pinpoint design inefficiencies.
“The bigger-is-better designs typically hit diminishing returns, and we were able to identify this through our surface pressure signal analysis and maximize these wells for capital efficiency,” he said. “There’s proven economic value through the implementation of this technology.”
Expanding applications
The Middle Clear Fork case study is evidence that what is measured through surface pressure analysis is physically significant, Mr Szilagyi said.
The project team sees a role for surface pressure analysis as both a real-time control tool and a training platform for intelligent completion design.
“What we’re able to do through this platform, since we’re doing it in real time, is automate a lot of those decision-making workflows. It’s dependent on the operator and area. However, we can input different exception-based rules into the system to respond to different conditions appropriately,” Mr Szilagyi said.
He noted that surface pressure data could be incorporated into multivariate analysis to enable predictive modeling of “what-if” design scenarios, for example. “The path forward is really utilizing these measurements in real time, transitioning from static designs to real-time adaptive completions, and using other tools like AI and machine learning to be more predictive with our operations.” DC
For more information, please see SPE 230631, “From Overstimulation to Optimization: A Surface Pressure-Driven Workflow for Real-Time Adaptive Completions.”