Performance drilling – definition, benchmarking, performance qualifiers, efficiency and value
By G. Mensa-Wilmot, S. Southland, P. Mays, P. Dumrongthai, and D. Hawkins, Chevron; P. Ilavia, consultant
Editor’s Note: This is the first in a two-part article on one operator’s perspective on performance drilling and how it can be used to improve efficiency and drive down costs. Look for a presentation on this topic by Graham Mensa-Wilmot, MAXDRILL (Performance Drilling) project leader with Chevron, at the 2009 Drilling Engineering Association Workshop, 19 August 2009, in Houston.
Drilling programs continue to be pushed into harder and more abrasive formations while directional drilling activities have become more complex. Well depths, profiles, dog-leg severity (DLS), departures and the other associated parameters are continuously being pushed into newer and more challenging frontiers.
Consequently, sharp operational cost increases are being recorded. The resulting economic impact challenges the practicality of the industry’s push for oil and gas in harsher environments. Considering the undeniable need to find new oil and gas reserves, the cost increases must be reversed. Performance drilling (PD), when effectively implemented, will serve as one of the enablers that facilitate achievement of this objective.
Researchers and engineers, to better understand the requirements that influence this objective, have committed time and resources to this endeavor. As a result, new drilling tools, technologies and processes are continuously being developed. Although project objectives have always been obvious, results have sometimes fallen short of expectations.
In some instances, and even when the intended performance objectives are achieved, the results have not been sustainable. To achieve its intended benefits, PD must sustain and continuously improve on past results. To achieve this goal, the industry needs to have an open discussion that focuses on PD and its constituents.
As a starter, PD needs a definition. Some believe that the use of a new tool or technology constitutes PD. In this regard, there is the assumption that what is new or claimed to be new technology is always better. Some also believe that the use of drive tools that increase RPM or torque (PDM or turbine) in a bottomhole assembly (BHA) qualifies as PD. Others associate PD with the use of rotary steerable tools (RST).
It must be stated that – even when relevant for a particular drilling operation – the mere use of a new technology or tool does not qualify as PD.
The ambiguity in PD’s definition has created a process vacuum. As an enabler to reductions in operational cost, it is not enough to just identify the need for PD. This realization must be supported by processes that help identify and optimize the factors that influence PD.
PD is the culture where the decisions and actions needed to achieve improvements in drilling performance are made and driven by detailed analysis of relevant data. The objective is to thoroughly scrutinize the data so that answers can be found for the following questions:
- What is working right, what are the associated behaviors, what characteristics are aiding these behaviors, and how can they be improved?
- What is not working right, what are the observed behaviors, what characteristics are causing these behaviors, and how can they be eliminated or minimized?
To answer these questions appropriately, emphasis has to be placed on the complete drilling system (drill bit, BHA, drive system, hydraulics). Components do not qualify as system members, merely on the basis of their technological advancements. They must establish relevance and contribute to the achievement of a project’s objectives. In addition, components must be functionally compatible with all members of the drilling system. The data analysis must focus on the drilling system’s characteristics and behaviors, not on the benefits or attributes of specific tools. Improvements are sustainable only if the implemented solutions address the underlying causes. In instances where performance lapses are attributed to specific tools, derived solutions must still focus on their functional characteristics. This emphasis improves system efficiency and facilitates the establishment of the behavioral trends needed to improve drilling performance.
BENCHMARKING
In a general sense, benchmarking is a look-back process. It is a vital part of a drilling program, which evaluates and documents drilling performance from a historic perspective. Benchmarking, as currently implemented, usually identifies what works. In some instances, the process is also used to identify what is not working.
Commonly, operators are advised to keep repeating what is working. In situations where performance deficiencies are identified through the benchmarking process, derived solutions have usually focused on what is not working. Solving a “what” problem usually focuses on individual issues or components. As such, supposed advanced products, in terms of technology, that focus on isolated deficiencies, are introduced. The shortfall with this approach is that isolated solutions, devoid of the compatibility and behavioral attributes, have compromising effects.
In line with the current discussions on PD, benchmarking as an evaluation process should be adapted to address issues of “how” and “why.” It must de-emphasize component solutions for behavioral effects that focus on the drilling system. This methodology, which focuses on the underlying positives or limitations of the drilling system, facilitates improvements that are sustainable. In addition, and due to the emphasis on behavioral trends, it establishes a culture of continuous improvement. This is possible because solutions that address “how” and “why” do not initiate compromising effects.
PERFORMANCE QUALIFIERS
Performance qualifiers (PQ) are dependent parameters that characterize the drilling operation from an efficiency standpoint.
Footage drilled per BHA, vibration control, operational life of drilling tools, ROP, directional effectiveness and borehole quality are classified as PQ. Improving drilling performance, as a means to reducing operational costs, requires optimization of PQ. Consequently, factors that govern PQ, and the associated PQ interrelationships (Figure 1), must always be identified and analyzed on a project basis.

Figure 1: Schematic listing performance qualifiers (PQ) as well as their
interdependencies, which must all be identified and analyzed on a project basis.
The drilling system and operational environment establish the factors that influence PQ. These factors include the hardness and/or abrasiveness of different formation types, weight on bit (WOB), rotary speed (RPM), BHA, flow rate (Q), and hydraulic horsepower per square inch (HSI), etc. In addition, drilling fluid type and rheology, well profile and drive systems also influence PQ.
Traditionally, the industry has accepted inverse interrelationships for PQs. As a result, PQ optimization has always been clouded with severe compromises (Figure 2). Enhancement to any particular PQ has usually been achieved at the expense of others. This predicament has flourished as a result of the industry’s earlier positions on PD and benchmarking.

Figure 2: Examples of compromises associated with PQ optimization.
The new benchmarking methodology, supported by the data-driven approach to PD, establishes new interrelationships for PQ (Figure 3). These new relationships, which are favorable to the PQ optimization process, are devoid of the types of compromises mentioned earlier.
 Figure 3: Example showing the latest PQ relationships (A to B) due to new performance drilling (PD) focus. Resolution of the old compromises results in improved directional effectiveness without sacrificing ROP (1 to 2).
DRILLING EFFICIENCY
On the subject of drilling efficiency (DE), dissimilar positions are held by different sections of the industry. Conventionally, DE is discussed as having a direct linear relationship with ROP (Figure 4). Additionally, DE has been strongly linked to cost per foot (cpf) through an inverse form of relationship (Figure 5). DE has also been associated with mechanical specific energy (MSE) through an inverse relationship (Figure 6).
Cpf is heavily influenced by the prices of the components used in the drilling operation. Additionally, and regardless of overall project objectives, ROP has a disproportionate influence on cpf. ROP maximization, achieved at the expense of other PQs, compromises DE. From a PD perspective, ROP advancements do not always improve DE. The PQ diagram (discussed earlier), analyzed in its entirety, is what governs PD, not the individual PQ factors.

|

|

|
Figure 4 (left): Perceived relationship between drilling efficiency (DE) and ROP.
Figure 5 (center): Perceived relationship between DE and cost per foot.
Figure 6 (right): Perceived relationship between DE and mechanical specific energy (MSE).
MSE, as a DE quantification methodology, is defined as the energy input per unit rock volume drilled.
![]()
![]()
Fundamentally, on-bottom drilling is a two-stage event, which compromises the following processes:
- Rock dislocation.
- Removal of failed rock.
The two processes, depending on formation hardness, are heavily influenced by both mechanical and hydraulic factors. Removal of failed rock, on the other hand, is heavily dependent on hydraulic factors. However, MSE as an evaluation tool focuses only on the mechanical aspects of DE.
From a PD standpoint, and considering the systemic effects of PQ, the effects and interpretations of MSE have to evolve. Most importantly, MSE does not always have to be low to ensure DE improvement. When borehole verticality is identified as a requirement for operational success, its achievement supersedes all MSE reduction strategies. Improvements in downhole tool life, borehole quality, directional drilling, hole cleaning, vibrations control and transitional drilling are events with similar effects on MSE values and trends. In all of these instances, the effect of ROP on MSE and the subsequent association to DE are overshadowed by the need for improved operational efficiency. Most of these issues, deemed more critical than MSE minimization, can be effectively addressed during project planning. Appropriate drilling system design, supported by effective drilling risks analysis, has strong effects on a project’s operational efficiency.
Based on this discussion, a new parameter referred to as mechanical drilling efficiency (MDE) has now been established. This parameter incorporates both MSE and operational efficiency. MDE is defined as the energy input per unit rock volume drilled, while establishing the conditions needed to ensure operational efficiency. Consequently, DE also acquires a new definition. DE is now characterized as the drilling and delivery of a usable well, while achieving the MDE requirements needed to establish the lowest cost imprint.
VALUE
The elements discussed here constitute the basis of an effective PD process. The objective must always focus on value creation through cost reductions. Value is created when PD establishes a culture that measures and continuously drives down operational costs.
To achieve this goal, on-bottom drilling time (OBT) must meet the following conditions:
- Effectiveness (for all hole sections and wells).
- Maximization (for specific hole sections and wells).
- Continuous improvement (minimization on a well-to-well basis).
For OBT to be effective, the drilling operation must progress (making hole) while achieving the performance objectives outlined in the PQ evaluation process. For OBT to be maximized, drilling-related nonproductive time (NPT) must be minimized. The conditions that make OBT effective, and ensure its maximization, also establish the groundwork for its continuous improvement. Once all the elements of PD are in place, and the culture ingrained, value creation must be sustainable. As a result, OBT – while still guided by PQ analysis and ranking – must be continuously minimized as more projects come on line (Figure 7).
 Figure 7: Effects of project count (data availability and effective benchmarking) on on-bottom time (OBT). OBT must be continuously minimized as more projects come on line.
In some instances, unplanned events (UE) occur, usually due to poor system definitions or inappropriate execution practices. As an example, wellbore instability or poor wellbore quality creates UE issues, which end up compromising OBT efficiency.
Evaluation of operational costs, as a means of quantifying value creation, must be assessed on two levels. First, it must be done on a well-to-well basis as per AFE requirements. The second-level evaluation must focus on the individual sections.
This approach, which focuses on an operation’s cost per section (cps), ensures identification of the sections needing the most attention, from a PD perspective.
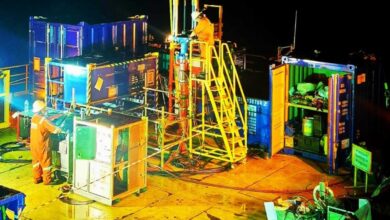
FIELD EXAMPLE
The processes outlined have been incorporated into several drilling projects. In all instances, a complete system analysis with emphasis on behavioral trends was implemented. One case history, executed in Mid-continent USA, which lends support to the definitions and processes discussed here, will be discussed.
 Web only graphic: Rock mechanics analysis shows the formation types, lithologies, confined and unconfined compressive strengths of intervals drilled on Almond and Blair projects.
The project required the drilling of vertical or directional wells into the Almond or Blair formations. The 9 5/8-in. surface casing is set at approximately 600 ft for Almond wells and at 1,500 ft for Blair wells. For Almond wells, KOP is in the shallower Lewis formation. Blair wells had KOP in the deeper Rock Springs formation. The formations situated below the Lewis are harder, have more sandstone content and present higher levels of heterogeneity. As a result, the Blair wells are more challenging from a drillability standpoint.
For benchmarking purposes, two Almond wells that had been drilled as part of the project’s initial phase (Well A and Well B) were analyzed. The vertical sections (shoe to KOP) on the identified wells drilled very differently. Consequently, this interval (drilled in 8 ¾-in. hole size) was identified as needing immediate PD attention. After elaborate review of the drilling program, and regardless of well type, the following PQ expectations were identified:
- Achievement and maintenance of wellbore verticality to KOP (without the use of steering devices).
- Footage consistency, with emphasis on Blair-type wells (considering increased formation hardness and abrasiveness – single BHA runs for “shoe to KOP”).
- Efficient use of drilling parameters.
- Vibrations control (elimination of downhole tool failures).
- ROP (while achieving footage requirements).
As a result, the offset evaluations focused on discovering why the initial wells had drilled differently. In addition, it was structured to identify the conditions and practices that had influences on the behavioral trends. ROP and MSE were both higher on Well B compared with the values recorded on Well A. However, footage drilled on Well A was much longer.
It is worth noting that the same bit type was used on both wells. In addition, the BHA, drive system (PDM) and hydraulic regime used on the two wells were similar. Interpreted in terms of the drilling program expectations, Well A had a better MDE ranking because of its superior operational efficiency.
Based on the PQ analysis, borehole verticality was identified as being the most critical. Once deviation was initiated, operational parameters had to be modified to re-establish verticality. The drilling system (BHA/bit), designed for the operation, had a self-correcting mechanism for deviation control.

Web only graphic: Offset well data, A (red) and B (blue), showing drilling parameters, ROP and MSE.
Once a low side was established for the wellbore, the drilling system created high side forces that worked to re-establish borehole verticality. The side forces pushed the bit sideways, thus creating a lateral offset at the bit face.
This behavior, coupled with the string RPM, created high cyclic torque values – resulting in severe vibrations (predominantly whirl). The drilling parameter changes, needed to activate the system’s functional mechanism, had compromising effects on ROP.
In addition, the drilling system (particularly the bit) sustained severe impact damage as a result of the induced vibrations. Once damaged, the bit lost its input to the system’s self-correcting mechanism. In addition to further compromising ROP, the sustained bit damage severely compromised footage. Considering the effects of deviation on MDE, the next phase of the benchmarking process focused on the sources of deviation.

Web only graphic: Bit used on Well A (left) and Well B (right). Dull conditions
of the same type bit (different serial numbers) used on the offset wells.
An inclination (INC) vs measured depth (MD) plot for wells A and B identified the zones where deviation was initiated (Figure 8). These specific zones (X, Y and Z), in comparison with the other sections of the interval, had much higher coal presence.
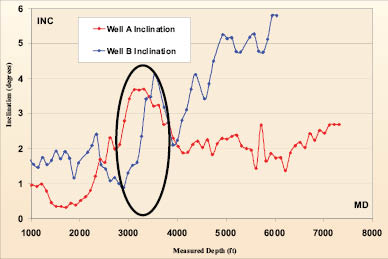
Figure 8: Plot of inclination vs measured depth for offset wells
(A and B), identifying primary zone of deviation initiation (X).
Following this realization, WOB was also plotted against measured. This plot (shown below) showed differences in WOB application, particularly in the first coal-bearing zone, where deviation was initiated on both runs.

Web only graphic: Plot of WOB vs measured depth for offset wells A and B,
showing WOB comparison at depths where deviation is initiated.
Of the two factors identified to have effects on deviation, WOB is the one that can be controlled from an operational perspective. Consequently, and based on further WOB vs deviation analysis, the following guidelines were established for the next wells:
- WOB has to be less than 16,000 lbs for the entire run.
- Maximum WOB could not exceed 12,000 lbs while drilling through the identified coal-bearing zones.
These stipulations, which necessitated a redesign of the BHA, challenged the usual practices of conventional drilling. Well B had shown a strong and positive ROP response to increasing WOB. However, due to the importance of borehole verticality, the listed operational changes had to be made for MDE purposes.
The next wells drilled (C and D) were deeper Blair-type wells. With the incorporation of the new PD principles, as well as the deviation mitigation strategies discussed, the wells were successfully drilled to KOP. Two additional Almond-type wells (E and F) were also drilled successfully to KOP. It is worth noting that the same bit type, as that used during the initial campaign, was used on all wells.
Project objectives, outlined by PQ expectations and MDE requirements, were achieved on all of these wells. The performance summary for all the wells drilled, before and after incorporation of the new PD principles, is presented in Table 1.

Table 1: Performance summary showing cost savings on Mid-continent USA wells.
CONCLUSIONS
- Operational costs continue to see sharp increases as drilling is pushed into deeper and harsher environments.
- Performance drilling is seen as one of several enablers that will facilitate reversal of the increasing cost trends.
- Performance drilling must focus on behavioral issues.
- The contributions of benchmarking to the performance drilling process needs to be centered on the “how” and “why” of an operation’s outcome.
- Performance qualifiers need to be identified and ranked on a project basis in order to continuously drive down operational costs.
- Performance qualifier interdependencies must be analyzed in order to eliminate compromising effects.
- Drilling system components must establish relevance and contribute to overall system compatibility and efficiency.
- Conditions needed to establish operational efficiency must always supersede the requirement for MSE minimization.
- On-bottom time must meet the conditions of effectiveness and maximization (on a section or well basis) and minimization (on a well-to-well basis) so as to ensure value creation.
- Drilling efficiency, in addition to achieving MDE requirements, also establishes lower cost imprints.
“Performance Drilling – Definition, Benchmarking, Performance Qualifiers, Efficiency and Value,” SPE/IADC 119826, G. Mensa-Wilmot, S. Southland, P. Mays, P. Dumrongthai, and D. Hawkins, Chevron, and P. Ilavia, Consultant, was presented at the 2009 SPE/IADC Drilling Conference and Exhibition, Amsterdam, The Netherlands, 17-19 March 2009.
Acknowledgement: The authors thank Chevron Corp for permission to publish this paper. Special thanks go to Jeffrey Smith, David Hawkins, Mike Cluchey, Phil Ilavia, Richard Smyrl and Mirambek Ataushiyev, of Chevron’s MCA Business Unit.
References
- Pessier, R. C., Fear, M. J.: “Quantifying Common Drilling Problems With Mechanical Specific Energy and a Bit – Specific Coefficient of Sliding Friction” SPE 24584, October 1992.
- Perrin, V. P., Mensa-Wilmot, G., Alexander, W. L.: “Drilling Index – A New Approach to Bit Performance Evaluation” SPE/IADC 37595, March 1997.
- Taylor, M. R., Murdock, A. D., Evans, S. M.: “High Penetration Rates and Extended Bit Life Through Revolutionary Hydraulic and Mechanical Design in PDC Bit Development” SPE 36435, October 1996.
- Hernandez, M., MacNeill, D., Reeves, M., Kirkwood, A., Lemke, S., Ruszka, J., Zaeper, R.: “High-Speed Wired Drillstring Telemetry Network Delivers Increased Safety, Efficiency, Reliability and Productivity to the Drilling Industry” SPE 13157, March 2008.
- Bailey, J. R., Biediger, E. A. O., Gupta, V., Ertas, D., Elks, W. C., Dupriest, F. E.: ”Drilling Vibrations Modeling and Field Validation”, SPE/IADC 12650, March 2008.
- Mensa-Wilmot, G., Krepp, T.: ”Innovative Cutting Structure Improves Stability and Penetration Rate of PDC Bits Without Sacrificing Durability” SPE/IADC 39310, March 1998.
- Dupriest, F. E., Koederitz, L.: “Maximizing Drill Rates With Real-Time Surveillance of Mechanical Specific Energy” SPE/IADC 92194, February 2005.
- Mensa-Wilmot, G., Calhoun, B.: “PDC Bit Durability – Defining the Requirements, Vibration Effects, Optimization Medium, Drilling Efficiencies and Influences of Formation Drillability” SPE 63249, October 2000.
- Sinor, L. A., Powers, J. R., Warren, T. M.: “The Effect of PDC Cutter Density, Back Rake, Size and Speed on Performance” SPE/IADC 39306, March 1998.
- Mensa-Wilmot, G., Fear, M. J.: “The Effects of Formation Hardness, Abrasiveness, Heterogeneity and Hole Size on PDC Bit Performance” SPE/IADC 67698, March 2001.