New tool enables visualization of real-time EFD, vibration data from multiple points in drillstring
Technology transforms high-volume data into visual displays that help drillers make better real-time decisions
By Isaac Fonseca, Jennifer Taylor and Andrew Creegan, National Oilwell Varco
The use of wired drill pipe to gather enormous amounts of high-frequency downhole data is an increasingly prevalent means to make informed, real-time operational decisions. Broadband network telemetry can transmit data from downhole tools to the surface at 57,600 bits/sec, a much higher rate than possible using a traditional measurement-while-drilling (MWD) system.
With this increase in data volume and enhanced capacity to supply data for multiple tools, new tools have been developed that can effectively use the increased amount of high-quality data. One such technology is National Oilwell Varco’s Equivalent Fluid Density (EFD) Viewer, which provides a method of capturing high-speed annular pressure and vibration data at multiple placements in the drillstring to provide the driller with real-time EFD and vibration visualization.

Current methods of collecting downhole data have been limited to one position within the drillstring. This has typically been at or near the bottomhole assembly (BHA), where vibration is typically the strongest. However, multiple points within the drillstring are subjected to different forces at different times. Annular pressure, in particular, is critical when trying to understand how drilling is affecting the formation above the BHA.
Places of interest for the annular pressure can vary depending on wellbore trajectory, cuttings beds and the physical limits of the drilling environment, such as RPM and flow.
The system can also be used to evaluate the actual pressure that formation is subjected to during the drilling process and to monitor it for fracturing. Because pipe movement can cause large fluctuations in annular pressure, this can cause a drawdown (swab) or pressure increase (surge). This can cause premature fracturing of the formation or a kick and can be complicated by hole cleaning or constant pressure surges being forced on the formation. With high-frequency data, changes to the wellbore pressure are noted and can be evaluated against wellbore position and rig procedures.
In an ideal tool placement, a BHA would incorporate three along-string measurement (ASM) tools: one at or near the BHA, one in the lateral, and at least one above the curve or near the 45° position of the curve. This allows management of the curve for hole-cleaning purposes.
A minimum of two tools is required for visualization of the EFD Viewer. Multiple tools at data transmission rates of 80 Hz provide instantaneous data visualization to generate a color heatmap of EFD data and torsional and lateral vibration data.
The use of multiple tools is beneficial but difficult to follow on a traditional log format. Even using real-time software to view log data does not allow enough time scale to evaluate the downhole pressure changes effectively. The heatmap EFD Viewer can be customized to provide values along the drillstring and document fracture or pore pressure issues. The vibration data allow for a quick review of the pressure and how the vibration is affecting the data.
Phenomena that the EFD Viewer has quickly visualized include wellbore instability, circulation loss (or influx), wellbore breathing, and drillstring dysfunction such as stick-slip or lateral vibration at different points within the drillstring.

It is helpful to know the location of problem zones in order to evaluate the best possible outcome. This may include common well profile areas of concern, like a heel in a lateral where cuttings tend to accumulate, or a zone that has typically been known to cause mud losses. The heatmap can then be set up to review that zone, highlight the pressures that are seen during typical drilling activities, and set up procedures to mitigate risk in these zones.
The EFD Viewer can also be utilized if there is a zone that is believed to be problematic. One tool should always remain above that zone and one below it to allow for monitoring of annular pressure across the zone. An analysis in real time is evaluated on losses or maximum pressure experienced in that zone.
In one project, higher mud weights were noted on a formation without problems. After analysis of the data, it became clear that it was rig activities causing the swab/surge that was prematurely weakening and fracturing the formation while drilling. This allowed for a change in mud-weight management and new rig tripping procedures, resulting in a more stabilized wellbore and savings in mud requirements.
These learnings were then applied across the field, increasing the operator’s savings.
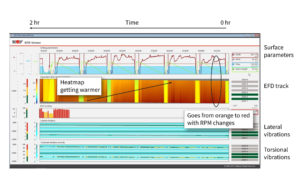
In Figure 1, the heatmap shows how the colors are getting warmer (higher EFD) as they are progressing over two hours. This is indicative of cuttings beds gathering below the uppermost tool. The setup allows visualization of how the cuttings are building near the BHA on the first tool before moving to the second and third tools.
Once the cuttings are noted, the change in RPM to higher values (circled near the top right) begins causing small pressure surges to the system. This can illustrate how the buildup of cuttings is now allowing changes from the drillstring to induce high-risk pressures.
It can also be noted in Figure 1 that the lower track, which is the torsional vibration, shows that as the cuttings are building up, the torsional vibration is increasing in magnitude.
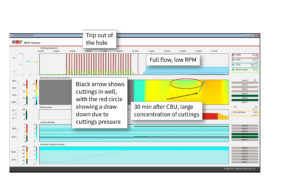
Figure 2 shows an example of a trip to the curve and a resulting bottom up. When the flow starts, the colors are yellow, as expected for the flow rates. Then, the pressure between the first and second tools become warmer, indicating cuttings have moved into the fluid column. Thirty minutes after the circulation started, the entire column was a warm orange, with EFD continuing to rise.
The final part of the graph shows that the fluid column is back to mud weight, indicating the cuttings bed has moved past the downhole tools. This shows the max EFD that passes by the open formation, making clear that an additional cleanup cycle may not be helpful, and time can be saved.
In West Texas, the heatmap has been used to diagnose wellbore instability, losses and swab during pipe reciprocation. This was accomplished by a close monitor of the system that produced the max EFD that the zone could handle.
The system provided early warning of caving issues, and the data was utilized to optimize tripping speeds for wellbore stability. This visualization was available in real time to both the rig floor and back office, allowing for instant decisions and preventing higher costs from being incurred.
As the wellbore geometry of many pads in West Texas is similar, the information gained during the use of the EFD Viewer was passed along to multiple rig practices. This provided an economic benefit to the operator as it allowed quick changes to multiple rigs with the information received.
As the data could be received in real time, it was possible to evaluate how a high-vis sweep and high-density sweep affect the cleaning of the wellbore and what, if any, changes occurred in the system.
The EFD viewer has also been used in managed pressure drilling (MPD) wells to manage the EFD limits across the entire well, including how to inject nitrogen. In one project, a large quantity of nitrogen injected all at once was found to decrease the mud weight too much at one time. The EFD Viewer was then used to fine-tune the procedure of maintaining the EFD pressures while the nitrogen was being added.
Another benefit of using wired drill pipe in MPD wells is the transmission of surveys and toolface without the need for tool pressure or flow requirements. As most MWD systems use the mud column for pressure pulses, the system becomes less capable of transmitting that signal as more nitrogen is put into the system. An MWD tool also requires flow to turn the tools on.
Using wired drill pipe, however, will provide the data with the pumps off and no requirements for the system to be transmitting. This provides the user with the ability to see in real time the management of the backside pressure by utilizing internal pressure and annular pressure measurements.
Conclusion
High-frequency, real-time data have recently become increasingly economical to obtain, and wired drill pipe has made this type of advanced visualization possible. With improvements in the design and manufacturing of wired drill pipe, the associated telemetry network now achieves approximately 99% uptime.
The industry’s challenge is what to do with this data to transform it into real operational value. The EFD Viewer has taken that data and created a one-screen visual display to quickly read the wellbore pressure management and drillstring dysfunction. This allows the drillers to look at the string and quickly make better decisions to optimize drilling practices and parameters. DC


