JIP study on BOP reliability 2004-2006: subsea control systems were most prone to failure
By Jeff Sattler, WEST Engineering Services; Frank Gallander, Chevron
In 2008, several industry groups created a task force to define the work scope for a joint industry project to study BOP reliability experienced for wells drilled in the US Gulf of Mexico from 2004 to 2006. They also tried to identify possible contractors and prepared, evaluated and awarded the bid for completion of this work scope, which included wells using either subsea or surface BOPs.
This article summarizes major findings and recommendations from the study, which had almost 90,000 individual component tests analyzed in the course of drilling 238 wells using 37 different floating drilling units and just over 40,000 individual component tests from 415 wells using 78 surface rigs.
The goal was to understand BOP reliability and the extent that testing impacts that reliability. The information on which the study was based incorporated data from both surface and subsea wells, using a significant number of different drilling units.
The full results of this study are limited to study participants. However, selected data were chosen for release.
BOP performance during the study time frame was significantly better than that of prior studies. Subsea systems had lower failure rates compared with surface systems.
BACKGROUND
The key objective of the study was to identify reliability of BOP systems when depended upon as a safety system. As a result, data were screened to include only failures that occurred after the BOP was maintained, tested and in service. In other words, failures that were identified as part of a rig’s normal maintenance and testing were not considered within this analysis. For subsea stacks, this means that performance was measured after the stack was run and successfully tested on the subsea wellhead. For surface stacks, performance was determined after the stack was nippled up and successfully tested.
For the purpose of this study, BOP equipment consisted of all related pressure-containment systems, including the control system, rams, annulars and valves, as well as the lower marine riser package (LMRP) and wellhead connectors for subsea systems.
A statistically significant population of wells was included in the study. Data reflecting approximately 99.58% of subsea wells drilled during the 2004-2006 period were obtained and analyzed. While the surface data set included more wells, only 38.2% of the universe of wells drilled in the area and time frame of interest was received and analyzed. This was because most data were gathered from study participants; these parties represented a larger fraction of the wells drilled using floating drilling rigs than those drilled with bottom-founded units.
Daily and well summary reports were the main source of data. The main content of the data captured was obtained from the description of the daily activities section of the daily well drilling reports; however, some data were also obtained from the remarks section and observation fields outlined in some reports.
For comparison purposes, failures identified from WEST surveys on rigs during this same time frame were collated.
Although this data is not directly comparable to that of the JIP, it gives a general indication of component failure distribution during the pre-installation testing phase of BOP operation.
Because of the large number of component tests and the small number of failures, correlation analyses all trend toward zero.
Correlations can be drawn from the data as categorized by several variables. However, they may not be statistically valid because the failure frequency is so low.
DEFINITIONS
Definitions for component failures, critical equipment, initial tests of well control equipment and other points are described below.
BOP operating days: the number of days that a BOP is in service. It is calculated from the date and time of the conclusion of the successful initial installation tests after latching or nippling up to the date and time of unlatching or nippling down the BOP.
Component failure: If the component did not test properly the first time, excluding problems with test equipment, then the component failed. This definition should not be a factor in how the operator conducts his BOP tests; it is specifically for the investigator to use in the interpretation of the test data. Multiple failures of the same component prior to resuming operations count as a single failure.
Safety critical failure: Failures that would prevent the BOP or a component of the system from closing and sealing on demand and allowing an uncontrolled release of fluid from a wellbore. This implies there is no backup system to allow shut-in.
Initial test: An initial test is the first test of the BOP equipment after installation on the wellhead. These have been excluded from this study based on the study objectives.
Mean time to failure (MTTF): the mean time expected from the time the stack was put in service to the first failure of a piece of equipment given in units of days. For constant failure rate systems, MTTF is the inverse of the failure rate (failures/day). It is calculated by dividing the BOP operating days by the number of failures.
STUDY RESULTS
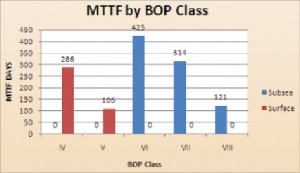
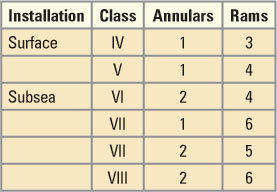
BOPs were grouped into different classes depending on the number of components (Table 1). From the classes as defined, it is clear that higher classes have more redundancy. To a lesser extent, one can also derive the age of the stack. Class VIII stacks were unknown to the industry a decade ago. Figure 1 shows the MTTF for these BOP classifications. It is not surprising that the lower classifications had higher MTTF as the component count is smaller.
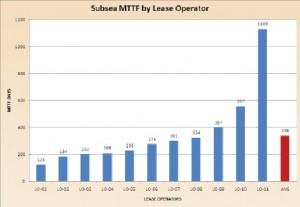
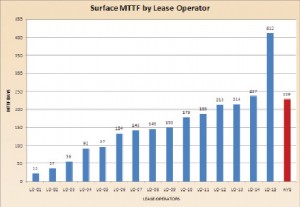
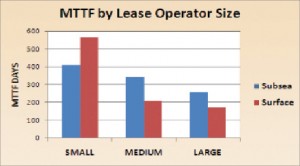
Performance was then correlated by lease operator and their relative sizes (Figures 2, 3 and 4), as well as drilling contractors and their sizes. The wide range of performance was particularly striking.
To understand if the variability in performance can be related to any definable variable, it was thought the only possibility might be operator size. Accordingly, operators were subjectively grouped as large, medium or small. A possible, although not quantified, explanation might be that the larger operators drilled more complex wells and used the higher class of stacks.
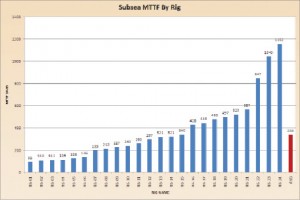
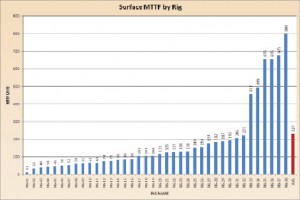
Similarly, Figures 5 through 9 show individual rig statistics that revealed differences in performance. Anticipating significant differences, the study identified parameters that could be correlated to performance. However, due to the combination of time lag between drilling and study times and limited records (and/or the ability to reliably gather theorized variables), this was not completed.
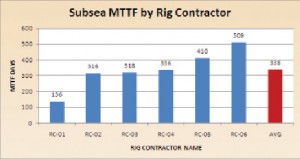
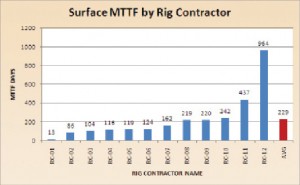
Also of interest is that the variability of the data is much less significant when comparing drilling contractor performance across their respective fleet of rigs that drilled the subject wells. There is much more variation in performance from rig to rig than contractor to contractor. The opinion of the authors is that this is primarily due to the rig staff.
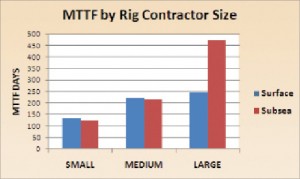
Once again, it was theorized that there may be a correlation between drilling contractor and performance. As can be seen, the worst performance in both rig types was delivered by the small contractor. It should be noted that there were only two small contractors in the data set; each had only a single rig included. Accordingly, drawing conclusions from this limited universe of data is considered suspect.
COMPONENT TYPES
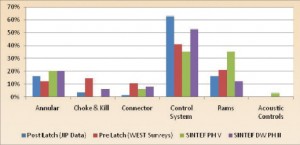
Figures 10 and 11 show the distribution of failures by component type. Four different studies or data sets were used for this comparative graph. The most significant number of failures for subsea systems occurred on control systems, by a large margin compared with other equipment classes. Conversely, very few control system failures were identified on surface stacks. The results of this study generally confirm the component failure distribution of prior studies.
As can be seen, choke and kill valves and connections comprised a significantly higher percentage of failures on the surface than subsea. The expected cause of the connection failures is the frequency of make/break cycles between these stacks and the wellheads to which they are bolted. The greater number of subsea control system failures compared with those that occurred on surface testing is believed to be primarily due to system complexity and hydrostatic issues that come into play in deeper waters.
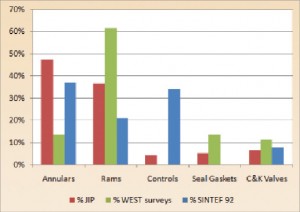
Even though control systems fail much more often, due to redundancy, there were not any cases either subsea or surface where a control system failure would have compromised the ability to control the well. Also important to keep in mind is that control system failures are typically discovered during function tests. The control system performance in Figure 11 for the SINTEF study was considered anomalous because the study included only performance from three platforms. The control system on one of those rigs accounts for the large proportion of controls issues in that study. Using these same data, measured reliability was compared. Note that, because of the wide variation of study MTTF, the Y axis on this chart is logarithmic.
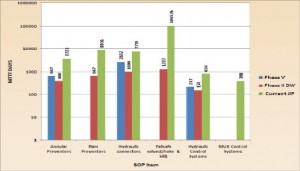
The guidelines of the study dictated that the BOP reliability after the initial wellhead test be evaluated, which was different from prior studies. Previous studies included testing prior to first successful testing. Data from SINTEF Phase V allowed the removal of these failures for a direct comparison to JIP data. However, for SINTEF Phase II Deepwater, these failures could not be removed and are thought to be a significant reason for the higher failure rates reported from this study. A direct comparison of the MTTF by component type and stack type (subsea vs surface) is shown in Figure 14.
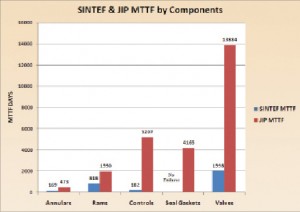
It is important to distinguish between failures that are found from pressure and those found from function testing. As determined in prior studies, subsea control system failures have again been identified as the most prone equipment to fail in a BOP stack. Not surprisingly, for surface systems, control systems have a high MTTF. In both cases, control system failures are identified during function testing, with the remaining identified by pressure testing.
CONCLUSIONS
To summarize the JIP study results:
• BOP reliability, as measured by GOM activity over the 2004-2006 time frame, has improved over that of prior studies.
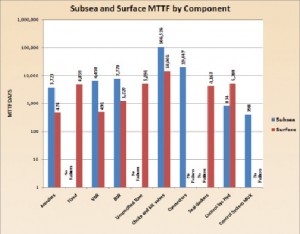
• Subsea performance of individual components other than control systems is superior to that of surface components.
3. MTTF of components other than control systems ranged from a low of 2.3 years (surface annulars and VBRs) to a high of 291 years for subsea choke and kill valves.
IADC/SPE 128941, “Just How Reliable Is Your BOP Today? Results from a JIP, US GOM 2004-2006,” was presented at the IADC/SPE Drilling Conference, 2-4 February 2010, New Orleans, La.
References:
1. Holand, P.: “Subsea BOP Systems, Reliability and Testing Phase V, Revision1 (this revision is based on a report with the same title published in 1990). SINTEF Report STF75 A89054, Trandheim, Norway, 1995.
2. Holand, P.: “Reliability of Subsea BOP Systems for Deepwater Application, Phase II DW,” SINTEF Report STF38 A99426, Trondheim, Norway, 1999.
3. Holand, P.: “Reliability of Surface Blowout Preventers (BOPs),” SINTEF Report STF75 A92026, Trondheim, Norway, 1992.

