Tests show potential of alternative method for offshore cuttings drying
New microwave technology may be able to remove organic phases to accepted levels
By M.S. Pereira, C.H. Ataide, Federal University of Uberlandia; R. Naufel, Ondatec; C.M.A. Panisset, C.H.M. Sa, A.L. Martins, Petrobras
Over the past 20 years, studies have been conducted to assess the effects of drilled cuttings contaminated by non-aqueous fluids (NAFs) on the environment. In Brazil, the environmental offshore discharge threshold for synthetic base is 6.9% in mass. Microwave appears to be a promising technology to remove the organic phase of these drill cuttings. This article presents a new microwave heating technique for the treatment of contaminated drill cuttings. For this purpose, a batch microwave oven was developed with up to 6 kW capacity.
In testing, the mass input was 6 kg and the microwave oven was airtight. Microwave cuttings remediation was investigated for three power inputs – 3, 4 and 6 kW – at 0.50, 0.60 and 0.70 kWh/kg and for specific energies ranging from 0.20 to 0.70 kWh/kg at 3 kW. The moisture content in rehydration was also studied in cuttings drying. The process can remediate the cuttings to below 2% using the specific energy of 0.60 kWh/kg. Cuttings drying by microwave heating is more efficient at low powers input. When cuttings that had already been dried were rehydrated and dried a second time, it was observed that the smaller the amount of water content, the better the secondary removal of n-paraffin.
Background
Cuttings contaminated with NAFs are a major source of waste from drilling activities. Offshore, these cuttings must be decontaminated from the organic phase before they can be discharged to the sea. This material can be treated onshore, but it is very expensive and the treated cuttings are still a residue and their disposal must follow specific regulations. Therefore, when economically and technically feasible, offshore decontamination followed by discharge at the location is the most attractive option.
In Brazil, in order to discharge overboard, the limit on residual n-paraffin content is 6.9 % in mass, the same standard used by the US EPA. Centrifugal driers are currently widely used in offshore activities, but concerns with efficiency and safety are pushing the development of alternate technologies.
Thermal desorption is a promising technology and industrially available. One major limitation is that, in some cases, the technique leads to chemical degradation of the fluid, making its reuse unfeasible. Vacuum drying is also a possibility, although fluid remotion levels are very close to legal limits. Supercritical extraction may also be a technically feasible alternative but is discarded by economical aspects. Thermal-mechanical desorption is a newer technique that seems to be technically feasible and does not lead to chemical degradation of the fluid. Cuttings reinjection is also a possibility, but its application is restricted by environmental legislation in several situations; further, it does not allow fluid reuse.
Microwave heating has emerged over the past six to eight years as a promising alternative. The technology has yielded good results in other applications, such as the generation of vegetable coal, which has motivated the development focusing on oilfield applications.
In conventional heating systems, the energy is transferred through conduction, convection and radiation. In microwave heating, energy is supplied directly to materials by molecular interaction with the electromagnetic field generated. Therefore, the elements or components of the material are heated individually and instantaneously, overcoming limits imposed by material heat transfer properties.
There are three generic classifications for behavior of materials in the interaction with microwave:
• Transparent (substances with a low dielectric loss factor) – The radiation pass through the transparent material with little or no absorption. An example is a molecule with no dipole moment, such as hydrocarbons.
• Opaque (conductor) – The microwave radiation is reflected and not absorbed by this kind of material. An example is the metal used as shielding of microwave ovens.
• Absorbent (substances with a high dielectric loss factor) – The electromagnetic field generated by the microwaves interact with the molecules’ dipole, increasing its rotational momentum and, therefore, its temperature. An example is a molecule with high dipole moment, such as water.
Microwave drying presents advantages when heating a mix of transparent and absorbent materials. The radiation passes through the components with a low dielectric loss factor and is absorbed by the molecules with a high dielectric loss factor, resulting in selective heating. Because of this, materials can be heated without the need for it to be done to the whole matrix, significant reducing energy consumption.
Two main advantages in the application of microwave heating in engineering processes are:
• Selective heating: Energy does not need to be provided for heating the entire volume of material.
• Volumetric heating: Energy can be transferred directly to an absorber element that is inside the bulk material, overcoming limitations of conventional heat transfer.
Because of microwaves’ selective heating capability, the hydrocarbons in a drilling fluid are not directly heated because they are transparent. On the other hand, water, which is emulsified inside the organic phase, is heated and converted to steam. When the steam escapes from the matrix, it drags the hydrocarbons. In this sense, the energy transfer mechanism is thermodynamically attractive because it is only required to vaporize the water fraction of the mixture that also contains the rock fragments and the organic compounds.
This article presents results of an experimental lab campaign to study the effects of power and specific energy on the drying capacity of microwave technology. The effects of a secondary drying section on the oil decontamination process, after cuttings rehydration, are also analyzed.
Experimental methodology
Microwave treatment system
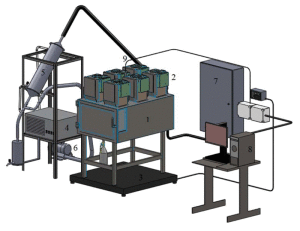
An experimental batch facility was set up consisting of: an oven cavity; six microwave sources with individual power of 1 kW and working at a frequency of 2.45 GHz; a 300-kg scale with a precision of 0.05 kg; an exhaustion system with a suction fan of 1.5 hp; a condenser; and a data acquisition system. The microwave sources can be turned on and off separately, generating applied powers ranging from 1 to 6 kW. The steam temperature inside the experimental unit is monitored by a thermal resistance sensor (PT 100) to avoid degradation (pyrolsis) of the oil base. The sources were turned off when the temperature increased up to a set point and then were turned on again when it cooled to a certain temperature. If pyrolsis is avoided, the condensed vapors can be reused as oil base. The unit is sealed so that external air would not get in even if there is suction (exhaustion). Figure 1 illustrates the experimental unit with its main components.
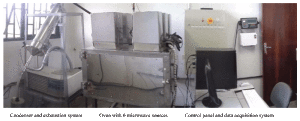
Figure 2 shows the different parts of the unit: the condenser vessel, which cools the steam phase and allows fluid recovery, the microwave oven, the control panel and data acquisition system.
The unit control system allows setting a reference temperature for the generated vapors. On the experiments, this temperature was 120°C, and it was maintained by an on-off control system. When the sources are turned on, the temperature of the vapors increase. The increase in internal temperature presents a delay so that even when the sources are turned off, temperature continue to for some time. The same thing happens when the temperature is dropping, and the sources are turned on again.
Due to this behavior, an operational procedure was proposed: When vapor temperature reaches 118.2°C (99% of 120°C), the sources are turned off. When the temperature reaches 118.2°C, the sources are turned on again.
On the first experiment, everything was kept constant except the number of sources, which were changed from 3, 4 and 6, resulting in a power of 3, 4 and 6 kW, respectively. For the other experiments, only three sources were used.
The effect of specific energy was also tested. It is the amount of energy kWh per unit of mass of residue to be treated. Every experiment was carried out setting three glass containers (a transparent material) inside the unit. Each container would have 2 kg of sample for a total of 6 kg. Since mass is constant in all experiments, the specific energy is varied either by changing the time to which the samples were heated or by changing the applied power (number of sources used during a test).
The heating time corresponds to the total amount of time that the sample was exposed to the microwaves (time the sources were on), whereas the total operating time also accounts for the intervals that the sources were off.
Material characterization
The material to be dried on the experiment to test power effect was dried cuttings from a drilling field mixed with n-paraffin based mud. The initial n-paraffin content on the cuttings was 4.2%, and the water content was 7.5%. The NAF fluid contained 5% of solids, a oil-to-water ratio of 55/45 and a density of 1.2 g/cu cm (10 ppg). After adding the drilling fluid, the n-paraffin content was 9.80±1.02%, and the water content was 12.06±1.30%.
To analyze the response of contaminated cuttings to various specific energies, the tests were carried out using material collected directly from a shale shaker on an onshore field. The n-paraffin content on the cuttings was 8.31±0.65%, and the water content was 9.78±0.87%.
The rehydration effect was analyzed by a mix of cuttings batches that was already dried on the test unit. The initial contents were 3.36 g of n-paraffin/100 g of solids and 1.51 g of water/100 g of solids. Then, solids with different levels of rehydration were generated by adding different amounts of water.
To analyze the n-paraffin content on the solids, before and after the drying procedure, tests were carried out using a 50 mL Fann retort. A sample was placed inside the equipment and heated until all fluid was evaporated. The vapors were then condensed and collected into a measuring cylinder, although it is common for part of these vapors to be lost during the condensation process. For this reason, the mass of liquid present in the sample was determined by the difference between the masses before and after the heating, not just by the mass collected at the graduated cylinder. The mass fraction of n-paraffin in the graduated tube was calculated and multiplied by the total evaporated mass to give the amount of non-aqueous base on the sample. By doing this, it is considered that the ratio of oil and water in the evaporated liquid is the same as the condensed one in the graduate cylinder.
It is important to note that, when this type of correction is applied, the results express higher and more accurate n-paraffin content than the standard calculating procedures. A 1-dg precision scale was used to weigh the separated components.
Power effect
Specific energy can be described by Equation 1 below, where E represents the specific energy (kWh/kg), P is the applied power (kW), t is the total time that the sample was exposed to the radiation (h), and m is the mass of the sample (kg). The same value of specific energy can be obtained by different combinations of power, exposure time and mass.
Equation 1
E = Pt / m
The effect of the applied power on the drying process was evaluated through tests using a constant sample mass (6 kg) while the power and heating time were varied. Three values of specific energy (0.5, 0.6 and 0.7 kWh/kg) with different heating times were applied to the test sample for each of three values of power (3, 4 and 6 kW). Each sample was treated by three distinct values of power, and for each power three values of specific energy were used, resulting in nine configurations.
All tests were performed twice. The values of power were chosen to maintain a uniform microwave distribution inside the cavity. For each test, the residual amount of n-paraffin was measured and the vapor temperature curve was recorded.
Specific energy effect
In this experiment, tests were executed with the intent to determine the influence of the specific energy on the drying process. The power was kept at a constant value of 3 kW, the mass at 6 kg and the initial content of n-paraffin and water. By changing the heating time, the specific energy was also changed according to Equation 1. The studied response variable was the residual content of n-paraffin. With the initial and final contents of n-paraffin, the percentage of removal of this contaminant was calculated.
Rehydration effect
Knowing that the organic phase is removed by the vaporized water, it was decided to analyze the effects of a secondary drying after adding water to cuttings that had already been dried. Water was added to dry cuttings until its content reached 12, 22, 27 and 32 g of water/100 g of dried solid material.
Tests were carried out for each sample using an applied power of 3 kW, a total mass of 6 kg and a heating time of 45 min, which resulted in a constant specific energy of 0.38 kWh/kg. The removed percentage of n-paraffin was calculated for each test. Using the obtained results, a comparison between the conventional retort results and the dry base calculation was made.
Results and discussion
Power effect
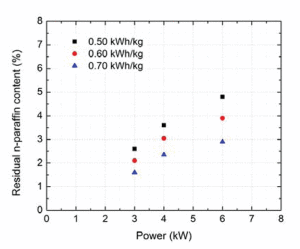
Figure 3 shows the effect of power and energy required for drying contaminated cuttings. Results indicate that the lower the power applied, the better removal of hydrocarbons, for a given specific energy. At all levels of specific energy evaluated, drying was more efficient as the applied power decreased.
For a given specific energy, the use of a lower power implies a longer heating time. Thus, for a given specific energy, the heating time to 3 kW is twice the heating time to 6 kW. Figure 2 shows that the power of 3 kW presents the best results for a given specific energy. The use of power that provided better drying invariably led to a longer operation time, which in practice means lower processing capacity.
The power of 3 kW was used as a reference for the other experiments relating the effects of specific energy and rehydration, even leading to a longer heating time. It can also be noticed in Figure 3 that, as the specific energy increases, the effect of power becomes less significant.
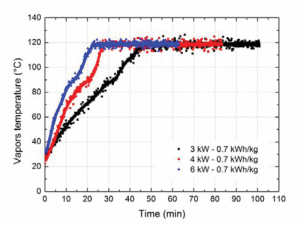
Figure 4 illustrates the heating curve for the three power values studied at 0.7 kWh/kg where the control temperature was 120°C. As expected, higher powers led to higher rates of heating before temperature control could be achieved.
Results indicate that the steam heating rate is intimately related to drying efficiency. The slower the drying process, the better removal of the non-aqueous phase. This phenomenon is likely due to the fact that, in rapid heating, the water is intensely removed in the first minutes without dragging the organic phase. On the other hand, in a gradual heating process, water is removed slowly so that it is able to drag hydrocarbons.
Specific energy effect
The graphs in Figure 5 shows the effect of specific energy in the contaminated cuttings drying to an applied power of 3 kW. As expected, the higher the specific energy, the better the removal of n-paraffin. Figure 5a shows the percentage of residual n-paraffin calculated by standard retort test as a function of the specific energy imposed. The percentage of n-paraffin before drying is 8.31±0.65%. However, this method is not the most appropriate way to evaluate the performance of drying equipment. This kind of equipment must be assessed based on the percentage of n-paraffin removed after the operation or the concentration of n-paraffin dry basis. Both methods are commonly employed for this purpose. Based on this, Figure 5b shows the percentage of n-paraffin removed as a function of specific energy.
The environmental legislation threshold for residual n-paraffin (6.9%) is achieved with 0.2 kWh/kg, and values below 2% can be reached with 0.55 kWh/kg. The nonlinear fit of the results shown in Figure 5a leads to Equation 2, where x corresponds to the specific energy required (in kWh/kg) to reach the y percentage of residual n-paraffin.
Equation 2
y = 13.12 exp -3.31x
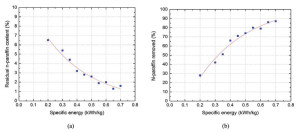
For the conditions studied, extrapolation of results suggests that levels below 1% of n-paraffin could be reached with 0.78 kWh/kg. The results also indicate that residual microwave technology can achieve lower n-paraffin levels than those currently achieved by centrifugal filter.
From Figure 5b, with specific energy of 0.35 kWh/kg and 0.70 kWh/kg, 50% and 87% of n-paraffin was removed, respectively. The nonlinear fit of the results in Figure 5b leads to Equation 3, where x corresponds to the specific energy required (in kWh/kg) to remove the y percentage of n-paraffin.
Equation 3
y = 144.57 exp -0.34 x -1
For the conditions studied, the results extrapolation suggests that 99% of n-paraffin could be removed with 0.90 kWh/kg.
Rehydration Effect
Figure 6 shows the percentage of n-paraffin removed with increasing moisture content. The applied power was 3 kW and specific energy was 0.38 kWh/kg. The results show that the higher the moisture, the less hydrocarbons are removed. It is assumed that this behavior occurs due to the added water that remains present at the material surface. Thus, this water is firstly removed, and it is not able to drag the organic phase.
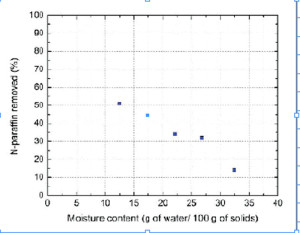
On the other hand, the water that composes the emulsion water/n-paraffin can remove organic phase because there is an interaction between these components. Hypothetically, added water is heated and removed without dragging organic phase so that energy is expended to remove only water. Note that the content of n-paraffin removed in a second drying stage (after addition of water) is lower than the results in Figure 5b.
Table 1 shows the results of n-paraffin and water content on a wet basis (standard retort calculations corrected for non-condensed vapor) and on a dry basis. Further, the percentage of n-paraffin removed during the second drying is also expressed. For sample 4, the percentage of n-paraffin by standard retort before drying is 2.8% and after drying it gets to 3.0%. A false increase in the percentage of n-paraffin can be observed.
In fact, 14% of all n-paraffin was removed; this shows how improper percentages on a wet basis can be for evaluating the efficiency of a drying process. Thus, the performance of drying equipment must be measured by the amount of n-paraffin on a dry basis or by the percentage of n-paraffin removed.
Conclusions

Lab results showed that microwave technology would be able to remove organic phases from drilled cuttings to levels that fit the Brazilian environmental legislation. Proper operational parameters allow removal of the organic phase to levels lower than those achieved by existing equipment.
In microwaves cuttings drying, the vapors heating rate is closely linked to the process efficiency. The lower the heating rate, the better the removal of organic phase. In batch systems, lower heating rates can be achieved using lower powers and higher drying times. The higher the specific energy, the better the process efficiency will be.
Regarding the ability of the process to remove the n-paraffin of drill cuttings, only 0.2 kWh/kg is required to reach the threshold of residual organic phase. With, approximately, 0.55 kWh/kg, it is possible to achieve levels of residual n-paraffin below 2%, and, by extrapolation, it can be stated that 1% of residual n-paraffin can be achieved with 0.78 kWh/kg.
The microwave drying results in removal of nearly all the water present in the cuttings. For moisture levels studied, when an already dried cutting sample is rehydrated and subjected to further drying, the smaller the water content, the better the non-aqueous phase removal.
It was also observed that percentages of residual n-paraffin provided by standard retort are inappropriate for evaluating the efficiency of a drying process. Therefore, a dry basis or percentage of n-paraffin removed should be used.
The next step includes studying the effect of microwave on the drying of different organic basis from drilled cuttings and the construction of a pilot-scale continuous operation microwave unit to evaluate the process under dynamic conditions.
Acknowledgments
The authors acknowledge the financial support provided by PETROBRAS and CAPES.
References
1. United States Environnemental Protection Agency (US EPA). 2000. Statistical Analyses Supporting Final Effluent Limitations Guidelines and Standards for Synthetic-Based Drilling Fluids and other Non-Aqueous Drilling Fluids in the Oil and Gas Extraction Point Source Category. Available at: http://www.epa.gov. Accessed in: oct. 31, 2012.
2. SEATON, S. Analysis of Drilling Fluid Base Oil Recovered from Drilling Waste by Thermal Desorption. In: International Petroleum Environmental Conference, 13, 2006, Texas.
3. HALLIBURTON. RotaVac® Rotary Vacuum Dryer (RVD). 2010. Available at: http://www.halliburton.com. Accessed in: oct. 31, 2012.
4. ELDRIDGE, R.B. Oil Contaminant Removal from Drill Cuttings by Supercritical Extraction. Industrial & Engineering Chemistry Research (1996), 35, 1901-1905.
5. THERMTECH AS. Thermomechanical Cuttings Cleaner (TCC): Setting the global Standard for the treatment of oily drill cuttings. 2006. Available at: http://www.thermtech.no. Accessed in: oct. 31, 2012
6. J.P. Robinson, S.W. Kingman, C.E. Snape, R. Barranco, H. Shang, M.S.A. Bradley, S.M. Bradshaw. Remediation of oil- contaminated drill cuttings using continuous microwave heating. Chemical Engineering Journal 152 (2009) 458–463.
7. J.P. Robinson, S.W. Kingman, C.E. Snape, S.M. Bradshaw, M.S.A. Bradley, H. Shang, R. Barranco. Scale-up and design of a continuous microwave treatment system for the processing of oil-contaminated drill cuttings. Chemical Engineering Research and Design 88 (2010) 146–154.
8. J.P. Robinson, S.W. Kingman, E.H. Lester, C. Yi. Microwave remediation of hydrocarbon-contaminated soils – Scale-up using batch reactors. Separation and Purification Technology 96 (2012) 12–19.
9. Patent required. Forno e processo de carvoejamento por microondas. N°: PI0306949-4. Deposited on: 12/11/2003. Classification: F24C 7/02.Brazil
10. R.C. Metaxas, R.J. Meredith, Industrial Microwave Heating, IET, 1983
11. R.J. Meredith, Engineers Handbook of Industrial Microwave Heating, IEEE London, 1998.h.
12. D. E. Clark, D. C. Folz, J. K. West. Processing materials with microwave energy. Materials Science and Engineering A287 (2000) 153-158.


