Industry needs standards for cement plug testing, placement to bump up deepwater efficiency
Weatherford develops plug position indicator system but says it’s only part of the overall solution
By Michael Trogus, Shell Exploration and Production, and Douglas Farley and Gregory Gaspard, Weatherford

As operators seek ways to keep every step of the drilling and completion process within budget, the process of cementing long casing strings has come under particular scrutiny.
To achieve a satisfactory cement job, the operator must have assurances that the top cement plug bumped, or landed on the lower plug in the float collar. Failure to achieve this might result in significantly longer drill-out times due to the additional cement pumped downhole, or in the possibility of a contaminated shoe track (wet shoe) for which a remedial cementing job may be needed.
A recent study of cementing operations on five deepwater rigs showed that, for 41 cemented casing strings ranging from 18 in. to 9 ⅜ in. in size, a total of 29 plugs were bumped successfully, which translates to a success rate of 70%. For the 12 plugs that were not successfully bumped, the study calculated an average 5.3 hours of NPT per well that was incurred while drilling out an average 86 ft of extra cement from the top of the cement to the float shoe (Figure 1). As the participating operator had eight rigs operating in the Gulf of Mexico that were drilling three to four wells per year at the time, then assuming five dart and plug systems used per well, the potential additional NPT could be more than 200 hours per year. In situations where overdisplacement occurs and a wet shoe results, an additional one to four days of rig time might be required to remediate the problem.
The study pinpointed several contributing factors to the problem of unsuccessful bumping of the top plug.
Displacement calculation errors

One major factor relates to errors in calculating the volume of cement required to displace the plug. The required cement volume is often approximated based on the calculated casing volume, which may differ significantly from what is required – particularly in the case of long, large-diameter casing strings.
The normal practice for calculating the casing volume begins with the internal diameter of the casing, with some allowance made for variations in wall thickness within API 5CT specifications. However, no common consensus exists for how much allowance should be given. One common practice is to caliper several joints and then base the calculations on the average caliper value – an approach that has proven fairly inaccurate.
In another approach, half of the shoe track volume is added to the planned displacement volume to compensate for casing thickness variance and calculation errors. When this volume is reached, pumping is stopped regardless of where the plug is at that time. When dual cement plugs are used, the volume required to bump the bottom plug is often used as an indicator, but the “free fall” effect of the cement column makes this unreliable.
Differing cementing procedures
Cementing processes often vary from rig to rig, making it nearly impossible to arrive at a commonly agreed displacement volume estimate. One procedure might calculate the volume of mud that compresses when the plugs bump but does not consider the hydrostatic pressure acting to compress the displacement fluid and temperature changes as the plug travels downhole. Another rig might not calculate compressibility volume but instead assumes that displacement using a 95% pump efficiency takes care of compressible volume.
Pump efficiency problems

No pump is 100% efficient, and efficiency can vary widely depending on the pump condition. For example, at 100% efficiency, a triplex pump with 6 1/2-in. plunger and 12-in. stroke can pump 0.122 bbl/stroke. Let’s say the calculated displacement is 1,280 bbl. With the pump operating at 96% efficiency, the actual displacement would be 1,229 bbl – 51 bbl less than the required displacement. In a 16-in., 84-lb/ft casing string, this would cause the cement to be located 280 ft higher than it should be to allow for efficient bumping of the top plug.
Fluid compressibility
Plug displacement can also be affected by the fluid conditions while the plug is chasing the cement column. Until such time as the mud begins to be pressurized to displace the cement, only the hydrostatic pressure is acting to compress the displacement fluid. At whatever depth the plug finally catches up to the cement column and begins to displace it with applied pressure, the fluid compression will be affected by both the displacement pressure and the hydrostatic pressure. Therefore, determining when these events occur can affect the displacement calculations. In addition, temperature changes as the plug travels downhole can contribute to variations in the displacement calculations.
Cement plug degradation

Cement plugs are commonly manufactured from two basic materials. The first, a urethane elastomer, has been found to be compatible with fluids including water, mineral oil, diesel, isomerized olefins, ester LAO/10 blends, chemical washes, and commonly used spacer fluids, provided the operating temperature does not exceed 250˚F (121˚C).
Nitrile elastomers make up the second common class of cement plug materials and have been tested in the same group of fluids. They were found to be compatible to 400˚F (205˚C), with the exception of ester-based fluids, which are borderline acceptable at that temperature.
Developing new standards
The drilling industry recognizes well cementing as a crucial aspect of the construction of a deepwater well. Yet, while API RP 10F exists for evaluating the performance of float equipment, no such standard exists for cementing plugs. In 2011, the API attempted to address this deficiency by creating a Mechanical Cementing Plug task force that was charged with developing a technical report on recommendations for testing, evaluation and performance requirements for mechanical cementing plugs.

While this technical report has not been completed, Weatherford has embarked on its own initiative of developing a standardized methodology for cement plug testing and placement that aims to improve the quality of the cementing operation and minimize drill-out time. Basic recommendations for plug testing being pursued by Weatherford and other supply companies include:
• The effect of fluids on the plug elastomers;
• A bottom plug rupture (flow-through) dynamic pressure test;
• Plug fin bypass pressure test;
• Top plug pressure integrity test – top plug landing test;
• Latch in and out test for latching type plugs;
• Plug fin wear test procedure;
• Plug drillability test procedure; and
• Deformation test for wiper plug installed in a restricted ID.
Weatherford is advancing other plug testing protocols, including a wear analysis of plug material recovered during cement drill-out. The objective is to establish the percentage loss of fin top and bottom, which is an indication of plug wear resistance.
In one such example, plug material was collected during cement drill-out of a 16-in. casing string; the total distance traveled by the cement plug was 16,017 ft in a 16-in., 98.2 x 113.5 lb/ft casing string. Four fins were recovered, cut into 1/4-in. sections, and traced on a full-scale schematic of a new plug with the casing ID as a straight line. This was transposed onto an AutoCAD facility, and the percentage loss was calculated for the fins. Three fins were used from the bottom plug and one from the top plug. The average wiping area loss outside the 14.77-in. casing ID amounted to 26.6%. The third fin of the bottom plug had the greatest loss at 33.6%, but the first fin showed only 19.9% loss. Photos of the retrieved samples showed sufficient interference with the casing ID, indicating that the plugs could reliably contain pressure, separate fluids and provide superior wiping ability.
Attempts have been made to develop a testing protocol for wiping efficiency, which include testing plugs in casing retrieved from old wells and visually inspecting the casing ID. Another measure of wiping efficiency evaluates the force required to push the plug into and through the casing; the desired loading force balances the ability to successfully install the plug against the casing without damage, while maintaining maximum interference.
Weatherford also developed a test fixture that enables the evaluation of plug performance under exact well conditions.
Precision plug location
The most important aspect of cementing plug deployment is knowing the location of the top cementing plug in the casing string. Calculations are estimates of the plug position. A system is needed that can give an accurate indication of the plug position as it nears bottom.
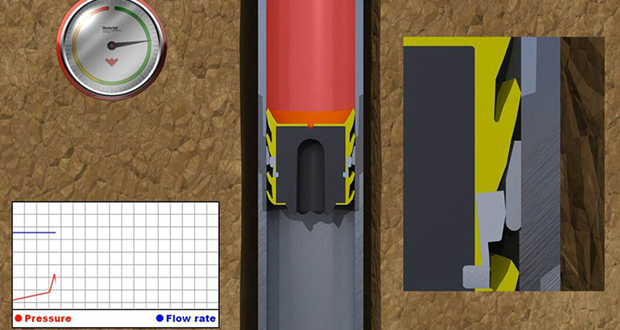
To that end, Weatherford has developed a plug position indicator consisting of a special locator collar (Figure 3) that is installed in a collar of the casing, several joints above the float shoe where the plug is required to land. To provide an indication that the plug has reached this known position, the top cementing plug has aluminum yield segments mounted externally that impinge on the locator ring and require an additional 300 to 700 psi of displacement pressure to compress them and allow the plug to pass through.
The additional pressure for that compression results in a momentary pressure spike at surface, which provides a precise location of the plug and, thus, a precise number for the remaining displacement to bump the plug (Figure 4). This system addresses miscalculation of displacement volume, fluid compressibility issues and pump efficiency considerations.
Positioning of the locator collar above the float equipment or landing collar should always account for the theoretical compressibility of the mud and the volume of cement. Consideration should be given to other pressure events that could overlap with the plug indicator collar, such as the rupture pressure of the bottom plug. The locator collar placement should be a minimum of 1.5 times the estimated compressibility volume of the displacement fluid above the float collar, thus giving time to recalculate displacement volumes based on the pressure indication seen at surface as the locator plug passes through the profile in the locator collar. If required, more than one locator ring can be installed to act as a progress report as the plug descends.
In this way, bumping of the plug can be essentially guaranteed. Data collected on plugs bumped over several years for a Gulf of Mexico operator showed a considerable increase after the operator began to use the plug locator system in 2012 (Figure 5).
Conclusion
As deepwater wells proliferate and necessitate the use of longer casing strings, improvement in the quality of cementing operations is an important contribution to drilling and operational efficiency. While a cement plug locator system can help, the need remains for deepwater industry standards in the manufacture, testing, and operational performance of cement plugs.
Information in this article was sourced from SPE/IADC 173066, “Studies of Cement Wiper Plugs Suggest New Deepwater Standards,” presented at the 2015 SPE/IADC Drilling Conference and Exhibition, London, 17–19 March 2015.