Global drilling industry pushes LTI rate down to record-low 0.37 while fatalities remain same
The lost-time Incident (LTI) rate for the global drilling industry reached a record low of 0.37 in 2009 – a 25% reduction from the 0.49 rate in 2008. The global recordable incidence rate was reduced to 1.22, which is 33% better than the 2008 report of 1.82. Unfortunately, the number of fatalities did not see the same improvement, although it also did not worsen – it stayed the same as 2008’s 32 fatalities.
A total of 125 contractors, representing approximately 78% of the worldwide rig fleet, participated in the 2009 IADC Incident Statistics Program (ISP), which has tracked safety and accident information for the drilling industry since 1962. Data here account for 422.07 million manhours worked, during which a total of 744 LTIs and 2,581 recordable incidents were reported.
Incidence rates are calculated on incidents per 200,000 manhours. Data are compiled separately for land and offshore operations and for seven geographic regions – US, Europe, Canada, Central & South America, Africa, Middle East and Asia Pacific.

FATALITIES
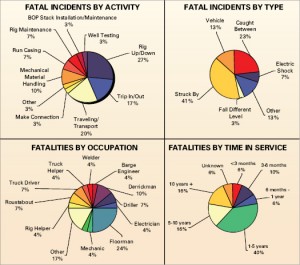
A total of 32 fatalities were reported in 2009; the incidence rate was 0.015, compared with 2008’s 0.014. Employees with one to five years of service with the company accounted for 12 fatalities, the largest percentage. Five victims had worked for the company between five to ten years; five had worked for the company 10 years or more.
Eight fatalities occurred during rigging up or down and six during traveling operations. Twelve deaths were “struck-by” victims while seven were “caught between” incidents. Seven fatalities were floormen, five were roustabouts and three were supervisors of driller or above.
SUMMARIES BY REGION
For land operations, Canada had the lowest LTI rate (0.19) of the seven reporting regions, and Europe had the lowest recordable incidence rate of 0.47. Offshore, Canada had the lowest LTI rate of 0.00 (no LTIs), while the Middle East had the lowest recordable rate of 0.66.
Europe
Contractors in this region worked more than 65.55 million manhours in 2009 – 32.95 million offshore and 32.6 million onshore.
European land workers improved their LTI rate 28% from 0.46 in 2008 to 0.33 in 2009 and improved recordables 59% from 1.16 to 0.47.
The LTI rate offshore Europe worsened 11% from 0.27 in 2008 to 0.30 in 2009. Their recordable rate improved by 26% from 0.99 in 2008 to 0.73 in 2009.
One fatality was reported offshore and six were reported on land in this region, for a total of seven fatalities.
United States
Contractors here worked a total of 98.45 million manhours in 2009, with 64.94 million manhours on land and 33.5 million offshore.
US land contractors improved both their LTI and recordable rates in 2009. The LTI rate improved 10% from 1.03 in 2008 to 0.93, while the recordable rate went down 25% from 4.11 in 2008 to 3.07 in 2009.
Eight fatalities were reported on US land and two offshore.
Middle East
This region accounted for 89.46 million manhours worked in 2009, with 66.88 million on land and 22.58 offshore.
Land contractors here improved their 2008 LTI rate of 0.28 by 18% to 0.23 in 2009. They also improved their recordable rate by 2% from 0.93 to 0.91. Offshore workers saw their LTI rate improve 25% from 0.20 to 0.15, while their recordable rate improved 21% from 0.84 to 0.66.
Three fatalities occurred on land and no fatalities offshore in this region.
Africa
A total of 51.86 million manhours were reported here, 29.13 million on land and 22.73 million offshore.
Land workers in this region saw their LTI rate improve 31% from 0.62 in 2008 to 0.43 in 2009 while their recordable rate improved 12% from 1.70 to 1.50. The offshore workers’ LTI rate improved by 50% from 0.40 in 2008 to 0.20 in 2009. The offshore recordable rate improved 13% from 0.93 to 0.81.
Three fatalities were reported on land operations, and two fatalities were reported on offshore operations, for a total of five in this region.
Asia Pacific
Contractors in this region worked a total of 52.62 million manhours. Of that, 38.59 million were offshore and 14.03 million were onshore.
The land LTI rate here improved 25% from 0.40 to 0.30 while the land recordable rate improved 4% from 1.05 to 1.01.
Offshore workers improved their LTI rate as well, by 26% from 0.39 in 2008 to 0.29 in 2009. Their recordable rate improved 27% from 1.15 to 0.84.
Two fatalities were reported for the region, one on land and one offshore.
Central and South America
This region accounted for 60.96 million manhours, including 36.32 million on land and 24.64 million offshore.
Land contractors in this region improved their LTI rate 21% from 0.29 to 0.23 and improved their recordable rate 1% from 1.05 to 1.04. Offshore workers also were able to improve their safety: Their LTI rate went down by 15% from 0.34 to 0.29 and recordable rate by 31% from 1.34 to 0.92.
Five fatalities were reported in this region, four of them on land and one offshore.
Canada
Contractors here accounted for 3.16 million manhours, with 2.09 million on land and 1.07 million offshore.
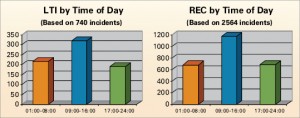
09:00-16:00 hours was the leading category in lost-time injuries and recordable incidents by time of day. Land workers improved their LTI rate 68% from 0.59 to 0.19, while their recordable rate improved 57% from 2.43 to 1.05. Offshore workers saw their LTI rate drop to zero for 2009, from 0.54 in 2008. Their recordable rate improved by 61% from 2.43 to 0.94.
No fatalities were reported for this region.
OTHER FINDINGS INCLUDED:
• By occupation, the floorman position suffered the largest percentage of injuries, similar to previous years.
• By body part, fingers were still the most vulnerable part of the body.
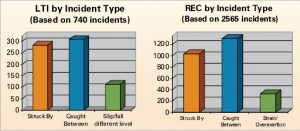
• By incident type, “struck by” and “caught between” accounted for the most incidents.
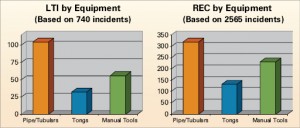
• By equipment, pipes/collars/tubulars was the equipment category responsible for the most LTIs and recordables.
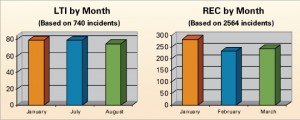
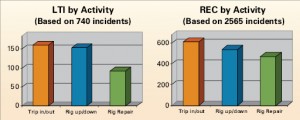
By month, January and July accounted for the most LTIs while January accounted for the most recordables. • By activity, tripping in/out involved the most lost-time and recordable injuries.
• By location, by far the most injuries in drilling operations occur on the rig floor.
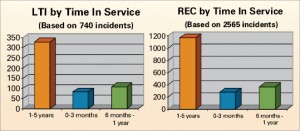
• By time in service, employees with between one to five years of service had the most LTIs and recordables, followed by employees with six months to one year of service.
• By time of day, the most LTI and recordable incidents occurred between 09:00-16:00 hours.
• By month, January and July accounted for the most LTIs while January accounted for the most recordables.
For more information about the IADC Incident Statistics Program, please contact IADC regional vice president North America & lead staff land HSE issues Joe Hurt at +1/713-292-1945 or joe.hurt@iadc.org.

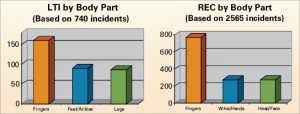



An intresting statistics noted from this is that the people above 10years are second in the maximum number of fatalities. It would be helpful if the causes are also plotted in graphical format which can give more insight.