Enhanced digital self-verification system improves reporting, risk awareness, leadership engagement
Targeted risk areas like shift handovers show clear progress, while other areas like hand safety offer room for further engagement
By Indira Ramjit-Prudent, Tucker Energy Services
In 2022, BP Trinidad & Tobago engaged its service contractor, Tucker Energy Services, in a consultative collaboration to evolve its original self-verification (SV) framework into an enhanced SV system. The combined efforts delivered a more robust toolkit – featuring updated checklists, clearer guidance and streamlined reporting — to bolster consistency and reliability across both onshore and offshore operations.
From the outset, clients played an active role: They helped shape the program’s objectives, reviewed each checklist iteration and offered feedback on improvement plans. This collaborative approach not only deepened buy-in but also ensured that the enhanced SV process is practical, transparent and aligned with real-world conditions — ultimately preventing incidents and minimizing disruptions at worksites.
The SV process serves as a proactive mechanism for verifying that operational controls are implemented at the jobsite. It also provides senior management and other stakeholders with assurance that work is conducted in conformance with BP’s established procedures and practices.
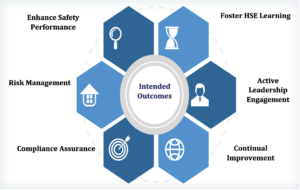
Intended outcomes
The intended outcomes of the enhanced design SV process are broadly categorized into six main areas (Figure 1):
- Enhanced safety performance: lower incident rates and negative impacts at the frontline
- Safety and risk management: verification of the effectiveness of existing controls
- Regulatory and statutory compliance: confirmation that all applicable requirements have been met
- Demonstration of leadership and commitment: active participation from various levels of organizational leadership
- HSE learning: fostering an improved HSE learning culture
- Continuous improvement: supporting the ongoing improvement cycle in safety management
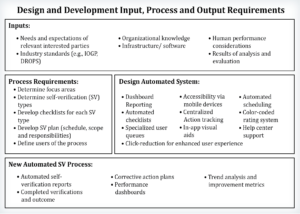
Technology played a pivotal role in the design of the enhanced process. Immediate, accurate information was required by both internal and external customers, leading to the creation of a purpose-built application.
Although innovative technology served as the catalyst for change, human-centered design ensured sustained adoption.
Close collaboration with field teams throughout the development guaranteed usability and adaptability under real-world conditions. Figure 2 illustrates the inputs, design decisions and outcomes that guided this process.
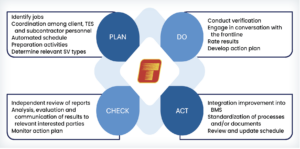
Operationalizing the enhanced SV
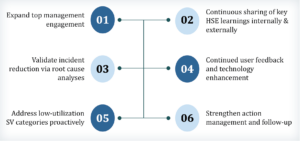
The Plan-Do-Check-Act (PDCA) cycle was applied to deploy the SV process across all business units and locations. Business Unit Managers, applying risk-based thinking, have the flexibility to select, schedule and assign an SV checklist to their teams based on specific job activities. The SV process supports verification checks at both client sites and Tucker Energy Services facilities, with a focus on relevance to each business unit’s scope of work and services. Figure 3 summarizes the key tasks in each phase of the PDCA cycle.
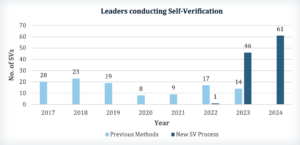
Leadership participation in the SV program has increased significantly (Figure 4). What began as a pilot initiative with a single leader in 2022 grew to include 41 leaders by 2023 and 61 by 2024, drawing representatives from top management, mid-level managers and field supervisors. This broad engagement has fostered a culture of accountability and shared responsibility at every level of the organization.
This rapid expansion reflects intentional program design rather than coincidence. Leadership expectations were woven into the SV framework: performance evaluations and field-visibility metrics now hinge on SV involvement. Senior executives set the tone by conducting onsite verifications, closing feedback loops and leading trend-analysis reviews, thereby demonstrating a clear and sustained commitment to oversight.
Results
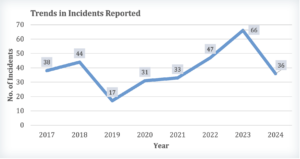
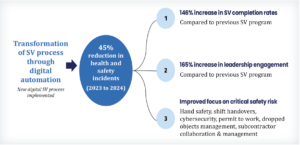
Figures 5 and 6 depict the results of analyses and evaluation over 2023-2024.
- Quantitative outcomes include a 146% increase in SV reports from 2023 to 2024, a 45% drop in HSE incidents over the same period, and annual SV completions rising from two in 2022’s pilot phase to 279 in 2024.
- Safety enhancements feature SV checkpoints and guides added to dropped objects, shift handover and subcontractor oversight programs, plus expanded training on HAZCOM, cybersecurity and client-specific safety protocols.
- There were no recorded incidents at any of the organization’s client jobsite.
BP’s engagement went well beyond advisory input, sharing insights from its own SV program, which enabled Tucker Energy Services to benchmark against international best practices. This collaboration delivered a unified safety lexicon rooted in IOGP guidelines, as well as ongoing mutual learning through transparent data sharing and joint leadership reviews.
Most significantly, this collaboration repositioned SV as a proactive, leading indicator, shifting its role from post-incident analysis to incident prevention.
Cultural transformation: From compliance to commitment
An effective HSE program does more than satisfy regulatory requirements — it inspires conviction. At Tucker Energy Services, the SV process has catalyzed a cultural shift, reframing safety from a rulebook obligation into a collective value. Embedding risk-based thinking has empowered teams to concentrate on high-consequence activities, such as work under pressure, shift handovers, explosive handling and cybersecurity. Through active use of the digital SV platform, frontline personnel have moved beyond mere form-filling to hazard recognition, timely intervention and contributions to organizational learning.
A compelling indicator of this transformation is the threefold increase in shift handover verifications between 2023 and 2024. That surge drove the creation of enhanced handover protocols, including standardized subcontractor oversight, originating from field-level insights and sustained by leadership advocacy. The result is an HSE culture that prioritizes proactive engagement and continuous improvement over checkbox compliance.
Conclusion
The automated SV process has delivered measurable gains in reporting, risk awareness and leadership engagement. A 146% increase in overall SV reporting between 2023 and 2024 underscores the impact of automation, digital tracking and user-centric design. Targeted initiatives in key risk areas — shift handovers, line of fire and cybersecurity — have demonstrated clear effectiveness, while more modest growth in risk assessment and hand safety highlights opportunities for further refinement.
A 45% reduction in incidents during 2024 validates the success of the new SV process. Continued emphasis on visible leadership, deeper process digitization and alignment of improvement efforts with quantifiable outcomes will further strengthen safety and efficiency.
Even more importantly, this level of engagement has driven a 45% reduction in health and safety incidents from 2023 to 2024, proving that when technology, leadership and culture align, measurable safety performance gains can be achieved. DC