Global land rig demand recovers, offshore still seeking inflection point
Clay Williams, President and CEO of National Oilwell Varco (NOV), speaks with DC Managing Editor Linda Hsieh about results of the 64thAnnual NOV Rig Census.
Onshore North America leads drilling activity gains, with international land drilling following modestly; global offshore utilization is still under pressure, with rig demand stabilizing and new supply coming to market
By Carlos Huerta, National Oilwell Varco
One year after setting record lows for utilization, the land rig markets in North America have seen a remarkable recovery. In the US, onshore rig demand surged by 105% to 976 active units, compared with 476 in the previous year. In Canada, there were 155 active land rigs during the census period, an increase of 65% over last year’s 94 units. Nevertheless, fleet utilization in both countries remain below normal at 46% (US) and 24% (Canada). Many lower-spec rigs are expected to exit the available fleet next year, as operators continue to give preference to higher-specification pad-capable rigs for development of onshore unconventional resources.
Internationally, there were 763 active rigs during the census period, 8.5% higher than the level seen in the 2016 edition. Overall, utilization improved marginally, up by 1% to 71% this year. Africa and Latin America are the regions with the lowest utilizations, at 55% and 42%, respectively. If low demand persists in these regions, some of the excess supply – rigs idle for more than three years – will no longer be considered as available in next year’s census.
For offshore rig markets, the cyclical bottom is still ahead. Global demand dropped by 7% from 2016 levels to an average of 429 units, and marketed utilization at the time of the census was 60%, well below normal levels in the 70% to 80% range. The inflection point for offshore rigs is expected to happen in the next few quarters as demand improves and rig retirements accelerate in an effort from rig owners to rebalance the market.
The available and active rig counts used for the census are calculated every year during a 45-day window in the late spring/early summer. A rig is considered active if it was deployed at any point during the census window; rigs are considered available if they have been active within the past three years (for land rigs) or five years (for offshore rigs). Offshore rigs that are confirmed to be cold-stacked are subtracted from the available fleet but are added back once the rig is marketed again.
Census highlights
Key statistics from the 2017 census include:
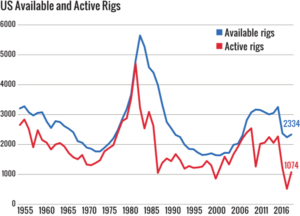
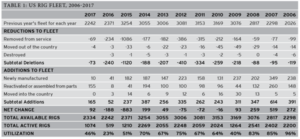
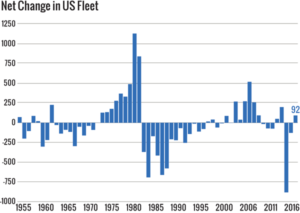
• The US fleet had a net increase of 92 rigs, raising the total available count by 4% to 2,334 rigs. This change is the result of 10 new rig deliveries and 155 reactivations, offsetting a total of 73 rig deletions (Figure 1).
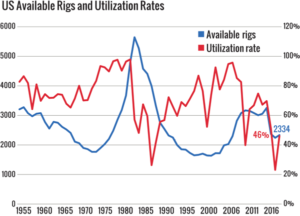
• Utilization of the US fleet (combined land and offshore) rose to 46% after two years of decline (Figure 2).
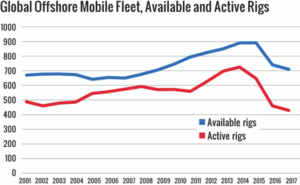
• The number of active global offshore mobile units fell by 6.7% to 429 units vs 460 in the previous census period.
• Overall international land rig utilization rose and stands at 71%, up from 70% in 2016.
US Rig Attrition
For this census, an available rig is defined as one that is currently active or ready to drill without significant capital expenditure. To be considered available, a land unit must not have been stacked for longer than three years and an offshore unit longer than five years. If it can be determined that a rig is cold-stacked, then it is removed from the available fleet. Extensively damaged rigs are also taken out of the available count. Rigs that have moved to other countries are not counted as available in the US; however, they may show up in the international tally.
All rigs removed from the fleet in each of these cases are totaled as “Deletions to the US Fleet.” There were a total of 73 rig deletions this year, compared with last year’s 240-unit decline and a 10-year average of approximately 316 deletions per year (Table 1).
The largest number of deleted rigs continues to come from the “Removed from Service” category. This number dropped from 234 units in 2016 to 69 units this year. In the land segment, most of these removals came from rigs being parted out to support the operation of other rigs. There were also important cold-stacking and scrapping efforts on the offshore side, accounting for approximately half of rigs removed from service.
At least four land rigs in the US were taken to other countries during 2017. These rigs were transferred by their owners to work in their international fleets. Latin America – Argentina and Colombia – were the destinations.
US Rig Additions
Ten new rigs were delivered into the US market at the time of this year’s census. In land drilling, demand for new high-spec, pad-capable rigs is the driver for new orders, as some drillers exhaust their existing fleet and require newbuilds to meet future demand from their customers.
Offshore, most drillers are opting to make arrangements to reschedule deliveries for future dates when market conditions are expected to be more favorable. This year, additions (newbuilds and reactivations) were able to offset the 73 deletions to the fleet mentioned previously, resulting in a net increase in the size of the US fleet for the first time since 2014 (Table 1).

With a total of 165 rig additions and 73 rig deletions, the net change in the fleet over the past year was a 92-unit increase (4%). This is a reversal from last year’s 5% drop. However, if US rig demand reaches a plateau of approximately 1,000 units as expected, several hundred land rigs will exit the available fleet in the next year. Most of these rigs will not return to the fleet as newer and more capable rigs will absorb most of the new “normal” drilling demand (Figure 3).
The demand for horizontal drilling currently exceeds the supply of the highest-spec drilling rigs. In addition to driving new rig orders, some of the larger contractors are working to upgrade their rigs to meet these requirements. Increased setback capacity, higher-torque top drives, walking systems and enhanced pipe-handling capabilities are amongst the most popular upgrades for the US domestic fleet.
Canadian Fleet

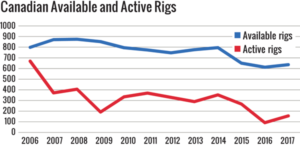
The Canadian available fleet rose by 4% to 637 units during 2017. The available data did not show clear evidence of rig removals from 2016 to 2017, but attrition is expected to become more obvious as activity levels stabilize and excess supply is trimmed.
In contrast, 14 newbuilds entered the Canadian market in the past year, and an additional 10 units were reactivated. This is a return to normal levels of additions for the Canadian market and almost five times the number of new rigs delivered in 2016.
The net addition of 24 units helped the Canadian market to rise from its historical low of 612 available rigs in 2016 to 636 units in 2017. However, oil prices will need to move substantially higher in order to sustain levels of 700 available rigs, more in line with the 10-year average (Table 2).
Turning to the global offshore fleet, supply and demand fundamentals remain adverse. Although drilling demand seems to be stabilizing, the magnitude of the order book and the schedule of deliveries will continue to put substantial pressure on fleet utilization over the next few quarters. During the census period, fleet utilization stayed at 60% – matching the record low set with last year’s 60%.
Rig owners are still actively looking to adjust supply to the current level of demand. Newbuild delivery delays, quicker cold-stacking decisions and accelerated retirement of aged and obsolete assets are being actively used to reduce operating costs and provide some support for dayrates.
In this census period, a total of 21 rigs entered the fleet, down from 30 in the previous year and 48 in 2015. A total of 51 rigs were retired from the fleet, and an additional 30 rigs were put into long-term stacking. Some of these cold-stacked assets will be reactivated when conditions improve, but some will remain sidelined and will eventually be demolished.
In aggregate, the available global offshore drilling fleet saw a net reduction of 30 rigs to a total of 710 rigs, and 429 units were active during the 45-day census period (Table 3).
If an offshore rig has not been active in the past five years and does not have a signed contract, it is removed from the available count until those conditions are met. This prevents rigs that cannot be quickly reactivated from being counted.
There were 21 new offshore rigs delivered in the past year, well below the average level of 40 units observed between 2009 and 2016. The main reason is that many offshore drillers are choosing to delay their delivery dates to reduce capital requirements and avoid having new assets sitting idle on their fleet.
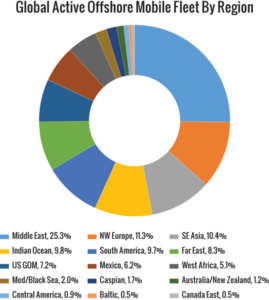
The worldwide offshore mobile fleet is widely distributed, with the top five regions – Middle East, Northwest Europe, Southeast Asia, Indian Ocean and South America – accounting for nearly 67% of all active rigs during the census period (Figure 4). Fleet composition by specific rig type is shown in Figure 5.

US Activity
The number of active rigs in the US surged to 1,074 units during the 45-day census period, more than double the number of rigs observed in the early summer of 2016.
The methodology used to count active rigs for the NOV census is different from other published rig counts. The NOV census counts a rig as active if it has drilled at any time during a defined 45-day period in late spring/early summer. For 2017, the window of activity was 6 May through 20 June. Most other published rig counts look at weekly activity. By using a longer observation period, the census does not miss rigs that are active and in transit from location to location.
This year, overall US utilization rose to 46%, compared with 23% in 2016. However, a large number of rigs that were drilling in 2014 will likely eventually exit the fleet, which could mean that actual “actively marketed” rig utilization is higher than the number calculated by applying this census methodology.

There were 1,260 available rigs in the US that were idle during this year’s census period. Most of these units are waiting for contracts. Census rules state that land rigs stacked for more than three years and offshore rigs stacked more than five years are removed from the available fleet.
In the next edition of the census, a higher overall utilization level is expected as obsolete rigs are moved out of the viable rig fleet going forward.
Census results for the US are also calculated by region. Most US regions had increases in available rigs for 2017, while the Rockies and Northeast states saw modest reductions to their fleet. The number of active rigs rose in every region for 2017. The year-to-year breakdowns for 2016 and 2017 are shown in Table 4.
The regional figures in Table 4 are a combination of land and offshore statistics. When looking at total US land rigs, utilization rose to 45%. The utilization rate was 23% in 2016. The US marine fleet utilization continued to drop in 2017 to 41% versus 62% last year. Demand for exploration and development offshore rigs by type varied greatly, with drillships having the highest utilization, at 71%, and semisubmersible rigs the lowest, at 33%.
Looking at the US land fleet, rigs can be compared by their drilling depth capacity. The land rigs with the highest utilization rate were the largest (depth capacity greater than 20,000 ft) at 62%, while the lowest were those in the 3,000- to 5,999-ft range at 15% This makes sense since horizontal drilling has dominated the activity in the country, and wells with large horizontal departures require larger rigs that can provide torque and enough hoisting capacity to drill these wells efficiently (Table 5).
Canadian Activity
Year-to-year statistics for Canada have fluctuated with commodity prices and the timing of the spring thaw, when rig moving is restricted in environmentally sensitive areas. Canadian rig activity rose by 4%. After having dropped to 91 active rigs in 2016, the active count was 155 units during the 45-day window of 6 May to 20 June (Figure 6). Utilization improved to 24%.

Segmenting the Canadian fleet by depth capacity, 32% of available rigs are rated between 6,000 and 9,999 ft, followed by 25% of units between 10,000 and 12,999 ft. Utilization by depth capacity shows that those with ratings over 20,000 ft have the greatest utilization. Some major players are shifting focus to the long-reach horizontal market, where deeper-rated rigs are required.
International Land Rig Utilization
The 2016 international land rig availability is estimated at 3,172 units, of which 2,252 were active during the census period. This results in a global land rig utilization level of 71%, marginally up from the estimate of 70% in last year’s census (Table 6).
Latin America had the lowest rig utilization, an estimated 42%. In Mexico, lower oil prices forced the operator to cut back on operations in the southern region and focus its spend on the Continental Shelf and exploration activities. Utilization in Argentina dropped to 51% but is expected to improve in the second half of 2017 and into 2018.
In Europe/FSU/Russia, low activity and a relatively low number of rigs in the region kept utilization at 73%. It’s estimated that Russia provides almost all of the rig count in the area, and estimates put Russian land rig utilization close to 80%.
For Africa, land rig utilization was estimated at 55%, having 71 active units and 129 rigs available for the purposes of this census. Algeria (96% utilized) and Kenya (70%) are the strongest in the area in terms of activity. Nigeria estimates point to 40% utilization of its land fleet.
In Asia Pacific, India and China are the strongest regions, with Australia coming in third place. Asia Pacific regional demand is estimated at 79%, with 760 active rigs during the census period.
Looking at the Middle East, the UAE and Qatar are essentially fully utilized, with Saudi Arabia running 104 of its 113 available rigs for a 92% utilization. Kuwait utilized 95% of its 56 available rigs in country. Drilling activity in the region remains stable, with upside potential once oil prices find strength.
US Industry Trends
The number of rig owners holding available rigs is also quantified. In recent years, the number of owners had remained mostly constant, with new drilling companies mostly offsetting companies ceasing operations. For 2017, the net number of rig owners registered a decline. Company closures, mergers and acquisitions, and large numbers of rigs being stacked all contributed to a net reduction of 25 companies this year. The total number of rig owners declined to 225 compared with 250 last year. The 10% reduction in owners is significant (Figure 8).

In the 2017 census, drilling contractors owned 89% of all US drilling rigs, and operators owned the remaining 11%, in line with estimates from 2016.
US Forecast for 2018
Drilling activity is expected to continue trending upward over the next year. Even when rig counts plateau in regions like North America, the fundamental undersupply of top-tier land rigs will drive some level of new rig orders, as well as upgrades.
The cyclical bottom for offshore rigs will come once “peak stacking” happens. The timing will vary depending on any further delivery delays or accelerated attrition of the existing fleet. The large order book for jackups will require more rigs to be scrapped in order to support better dayrates. For floaters, some green shoots can be seen in segments like harsh-environment semisubmersibles, with the potential to see initial orders over the next one to two years. DC

IHS Markit and Platts-RigData are the primary sources used for the global offshore and North America land rig fleets. Information for some areas, particularly the international fleet, was collected and analyzed by NOV personnel. Jacoby Garcia (RigData) and Steve Thompson (NOV) are recognized for their contributions to this year’s rig census.
Carlos Huerta is the Director of Technical Marketing and Industry Research at NOV Rig Systems. He began his career as a field engineer for ReedHycalog in 2002 and has held positions in drilling optimization, product line management, business development and sales management before joining the corporate technical marketing team at NOV. Mr Huerta holds a bachelors degree in chemical engineering from Tecnologico de Monterrey and an executive MBA from Rice University.


