Testing shows automated frac outperforms manual in control, consistency, performance, risk
By replacing human decision making with data-driven controls, variations in field crew experience that limit efficiency can be removed
By Stephen Whitfield, Senior Editor
The process of completions for unconventional wells can vary widely from program to program, and this variability can limit efficiency and performance.
There are numerous sources behind this variability, including the formation, equipment and human decision making of routine tasks. According to Price Stark, Production Enhancement Commercial Manager at Halliburton, automation represents the next step in eliminating that variability. Automation, he said, can unlock efficiency and consistency gains by enabling personnel to immediately respond to the formation with the expertise of defined routines, manage equipment using robust data streams and make decisions immediately from interpretation to execution.
“We have a lot of good teams in the field today, but it’s very inconsistent,” Mr Stark said. “There are a lot of different interpretations of what things mean. And people have different risk management profiles – some people are more willing to take more risks. Also, there are a lot of different set points we need to think about. Maybe you want to adjust your additives, or maybe you see pressure at the end of the stage and you want to drop it down. These are decisions that are being made.”
Speaking at the 2025 SPE Hydraulic Fracturing Technology Conference in The Woodlands, Texas, on 6 February, Mr Stark discussed Halliburton’s OCTIV Auto Frac system. It allows users to execute their fracture design without human intervention, automating thousands of decisions while pumping, based on user job designs and pre-job inputs, with constant response to dynamic stimulation conditions.
“Any given second of a spread with 20 or so pumps could have hundreds of thousands of setpoints. And if you’re always fighting to find this optimal level of decision making, you’ll find that some people are very good at it, and some are not. We needed to put all of this decision making into a system that provides a base level of control and automation,” Mr Stark said.
The primary hurdle to developing an automated completion system, he noted, was the historical control systems that run today’s completion fleets, which typically utilize analog controls. Most decisions in completions are manually executed, and that manual nature creates significant variations in performance based on the personnel’s experience, risk tolerance, response time and judgment in critical situations.
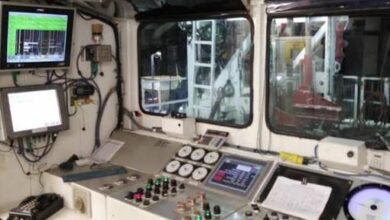
The Auto Frac system aims to eliminate these manual control processes and replace them with a data-driven operating system that standardizes the surface fleet’s operation. The digital control panel within Auto Frac accepts digital inputs from operator and service company personnel. For instance, the operator determines the desired properties of the fracturing fluid at the wellhead, such as slurry rate, treating temperature and proppant concentration. The service company focuses on the operation of the frac equipment, including setting the process parameters of each piece of equipment.
However, unlike a historical control system that requires manual operation, the Auto Frac system uses the inputs as a guide to automatically control the equipment connected to it.
Thousands of sensors installed on the equipment and throughout the frac spread provide the Auto Frac system with real-time data on the health of the pumps, the total load requested for a frac fleet, and how best to distribute that load across the entire frac spread.
“There are a ton of decisions that are made on every single stage, day shift, night shift, minute by minute, that you need to account for in this space,” he said.
Automation control is maintained through the traditional completion design, various automation settings, and the ability to enable remote execution input via manual control or machine learning. Mr Stark noted that the system enables manual override of the automation at any time, allowing humans to take back control when needed.
Traditional designs are still loaded before job execution through conventional means or direct design injection through computer connections. These designs are the sole domain of the operator.
Testing and results
Halliburton tested the system by running it with five separate frac crews operating in four basins over the course of a year-long period in 2022 and 2023. Mr Stark outlined four categories of metrics that Halliburton sought to address while trialing the Auto Frac system: control, consistency, performance and risk. Each was measured using conventional manual frac control systems by the same crews in the same basins in the year prior to deployment of the automated system.
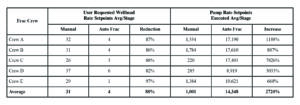
For the control metric, Halliburton looked at the desired change of wellhead slurry rate, as well as the rate setpoint updates to each pump. Mr Stark noted that, in the context of a frac stage, one of the most common real-time decisions is deciding what slurry rate to target. Although each fracturing stage may have a designed slurry rate, without automation, the operator must monitor the wellhead pressure, the state of the fracturing equipment and other information while fracturing.
Before frac automation was deployed, an average of 31 wellhead rate setpoints was required in real time at each stage, resulting in 1,001 pump rate setpoint changes. With the Auto Frac system, the average wellhead rate setpoints per stage went from 31 to just four (an 88% decrease), while pump rate setpoints executed per stage went up from 1,001 to 14,348 (a 2,720% increase). This indicated that the automation allowed frac crews to modify pump rates more precisely and effectively.
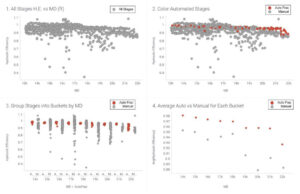
Halliburton used hydraulic efficiency as the metric to normalize changes in job design rates and volumes. Hydraulic efficiency is a measure of actual slurry volume divided by stage time – a higher number indicates greater efficiency.
Collectively, the average hydraulic efficiency improved by 4.6% with the Auto Frac system over manual (0.92 to 0.96). Mr Stark said the implications of this increase are noteworthy when accumulated across a completions program. For a frac job with the below parameters, then a 0.96 hydraulic efficiency rate would equate to a 4.7-minute reduction in pumping time per stage and a 151,500-bbl increase in throughput per month:
- 100 bbl/min designed rate
- 10,000 bbl/stage
- 15-min stage transition time
- 30 pumping days/month.
“A 4.6% increase in hydraulic efficiency is a lot. In the past, we would fight just to see a 1% increase. So when you see that kind of improvement, that’s significant,” he said.
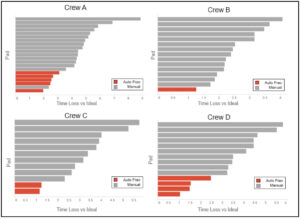
Halliburton measured treatment performance during testing as a function of time loss during the rate ramp period versus the ideal, with “ideal” referring to the point where the wellhead rate equals the maximum achievable wellhead rate within a given observed wellhead pressure. In other words, how much slower does it take to reach the maximum achievable wellhead rate than expected?
For the five crews analyzed, the time loss in the rate ramp period improved by 44% in aggregate with the Auto Frac system compared with manual. In all but one case, each frac job completed with automation outperformed even the best job completed with manual.
For risk, Mr Stark acknowledged the difficulty in quantifying this metric, given the lack of explicit measures commonly accepted within the industry.
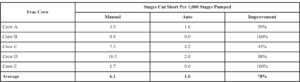
For Auto Frac testing, Halliburton measured the frequency of frac stages cut short. Mr Stark said it is common practice to conclude a frac stage before the designed proppant mass is placed; this is a response to perceived screenout risk. So, testing presumed that risk levels on any stage cut short is higher than on stages pumped to completion, and a job with lower frequency of stages cut short were presumed to be jobs executed with less risk.
All five crews saw an improvement in stages cut short per 1,000 stages pumped with the automated system versus manual. On average, the crews went from 6.1 stages cut short per 1,000 with manual operations to 1.6 stages with automation.
The Auto Frac system saw its official commercial launch in September 2024. In January 2025, Halliburton announced the launch of the Auto Frac system in Coterra Energy’s completion programs in the Permian Basin. DC
For more information, please see SPE 223511, “Auto Frac: Improving Consistency and Control in Completions.”