Case study: Technical, logistical challenges overcome to access DTS data on demand in remote location
Handling data at source, bringing it into cloud allows more data to be processed and value extracted
By Andy Nelson, Tendeka
Over the past decade, the implementation of the “digital oilfield” in all its guises has realized technical, safety and economical value across the life cycle of the oil and gas industry. Although a diverse range of digital technologies exist, operators continue to show reluctance to its application, meaning its uptake is still relatively slow and limited.
The success of any digital oilfield project is predicated on the quality of the data structure, acquisition, communication, validation, storage, retrieval and provenance of the data. This is made difficult by the variety of sensors producing data, the multitude of data formats, challenges with data communication and synchronization, and the potentially large volume of data produced. Storage systems must be secure, fast for storage and retrieval, and capable of handling multiple users or analytical software interfaces.
Conservative estimates show that the process equipment on a typical offshore platform generates 1-2 terabytes (TB) per day, while some estimates put the potential amount of data associated with each well at closer to 10 TB per day. Only around 1% of that data is used for decision making.
The use of edge computing, where data analysis and decision making can happen away from core centralized systems and closer to the location where internet and connected devices contact the physical world, has the potential to reduce the amount of data transmitted. The required information is derived by processing data from key sensors proximal to the source and transmitting only the information required to the central or remote data storage facility. This reduces the need for personnel on-site, or conversely, the need to go onshore to process data and make decisions. It enables faster decision making and better real-time data monitoring.
Proliferation of Sensors
From wells, rigs and pumps, to pipelines and refineries, vendors are embedding more internet-connected sensors into equipment. Coupled with the continuing reduction in cost of these sensors, the proliferation of these devices becomes more prevalent. According to BIS Research, the oil and gas IoT segment alone is anticipated to grow to $30.57 billion by 2026, with a compound annual growth rate of 24.65% from 2017 to 2026.
IoT devices offer a multitude of features that present operators with new ways of monitoring and managing existing assets and help drive compliance. The information collected opens the potential for automation and real-time decision making that can have a dramatic effect on well productivity.
However, to be adopted, these sensing devices must be simple to install and easy to both interact with and manage. Further, adding devices with frequent measurement sampling to the infrastructure also creates a proportional growth in the amount of data being generated. The data itself must have a direct correlation to an increase in productivity or efficiency before it will be implemented by operators.
Data Overabundance
Whether the well is located on an offshore platform or is land-based, the hardwire technology infrastructure to move massive volumes of data may either not exist or is only available in a minimal number of facilities. Evolving wireless technology standards are helping to improve data transmission speeds, but the growth of data generation significantly outpaces the ability to transmit that data.
As new technologies become available in subsurface monitoring, for instance, the growth in data volume is evident. A typical distributed temperature sensing (DTS) data file is approximately 160kb. Given that a DTS instrument typically produces a complete data set every six hours, the total data for a single fiber capturing DTS measurements would be 234 MB per year. By contrast, distributed acoustic sensing (DAS) data is generated at a rate of about 1 TB per hour. If a typical survey is conducted for nine hours, and one survey is performed each week, the DAS instrumentation would generate 468 TB of data per year.
Cabled solutions, such as fiber optic, Ethernet, coaxial cable and twisted-pair copper, provide much higher transfer rates and can alleviate some of the data transfer issues. However, the cost associated with deployment in a brownfield application can be considerable and, in many cases, is likely to be cost-prohibitive.
The optimal solution to the data volume problem is to decentralize the data analysis and move this to edge devices whereby the data is captured, transmitted and analyzed on a centralized or cloud-based system for reporting, alerting and enabling improved decision making.
Case study: Implementation of DTS
Understanding the relative contribution to production by different zones at different times in the well’s life, and whether production is dominated by a single zone, adds value to planning future wells. The initial implementation was for a multiphase development across 12 coal seam gas wells for a major producer in the Surat Basin in Australia.
As the wells were in a remote and extreme environment, the first obstacle to overcome was to secure and maintain power and connectivity. Minimal communication infrastructure – and at least six hours of driving time from the nearest manned location capable of providing support – proved problematic as fluctuations or power outages can have a direct impact on the effectiveness of the data and subsequent analysis, and ultimately the value of the DTS installation.
Enhanced Data Rates for GSM Evolution (2G EDGE) data speeds were, in some cases, the fastest wireless protocols available when the project was undertaken in 2016.
DTS Solutions
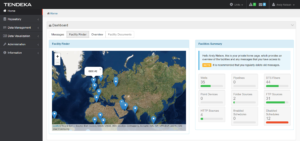
The first DTS units deployed in this field provided limited connectivity options as the only method to retrieve the collected data was via a proprietary Windows desktop application. Typical collection required someone physically visiting the site and downloading the data via the application to a laptop computer, and then returning that data to the office domain at a later time. Accessing the data globally anywhere within the corporate enterprise was a key requirement (Figure 1).
To provide a working solution, each well was equipped with either local gas-powered electrical generators or solar-powered units capable of running the DTS units and modem for extended periods without human intervention and, in the case of solar generation, throughout the hours of darkness and times of inclement weather.
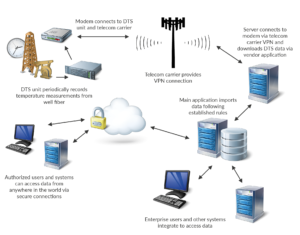
Each DTS unit was connected to a GPRS modem and, although slow in today’s wireless spectrum, GPRS is an extremely reliable method to communicate data. Large data transfers are not realistically possible due to the limited upstream bandwidth available (Figure 2).
Communication
The optimal hardware infrastructure was to have the DTS unit connected directly to the modem. The modem and wireless connection would provide a secure communication tunnel back to a centralized location for the data. Utilizing the telecom carrier’s infrastructure, a hardware-based virtual private network (VPN) was established between the modem and centralized servers. This infrastructure meant that the only way the DTS unit could be accessed remotely was via an established VPN over the telecom carrier’s network, thus securing the remote connectivity solution from outside intrusion. The carrier’s mobile network infrastructure would need to be breached before the remote well’s data was at risk from unauthorized access.
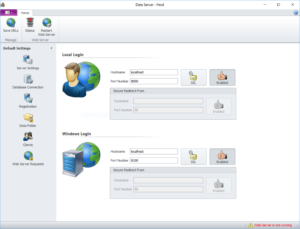
The modem was connected directly to the DTS unit via a serial communication port. The modem was then set up using its included features to provide a serial-over-IP tunnel. A server within the data center was configured with DataServer software to provide a virtual communication (COM) interface. This was used to accurately define, model and match data from sensors across the sandface to the wellhead. This uses proprietary algorithims and intuitive interfaces to seamlessly integrate multiple data sources into clear visual outputs.
A tunnel capable of linking a COM port on the DTS unit over potentially any distance to the server in the data center was also established.
Data recovery and analysis
Having created the physical connection, the next task was to recover the data. DataServer software was set up to continuously poll for new DTS measurements as they became available. Once recorded, the measurements would be retrieved from the DTS instrument and copied to the server (Figure 3).
A second server operating in the data center was installed with software responsible for managing the DTS data. This software is alerted to new DTS measurements being saved and proceeds to import those measurements. A workflow process of validating the data was the first step in the import process.
Each file is opened and checked against preconfigured rules to determine if the data is coming from the expected well site. For example, the DTS measurement data contains details about the well, such as a name or unique identifier, which must be validated before data is imported.
During import, any errors or data discrepancies are flagged in an alerting system to a human operator so that the data can be manually checked. The alerting system also notifies operators if the DTS unit appears to be offline, for example, if the data coming back from the instrument is corrupt or if the modem communications are down.
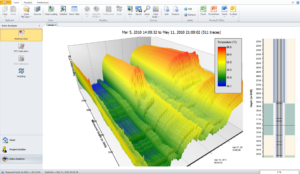
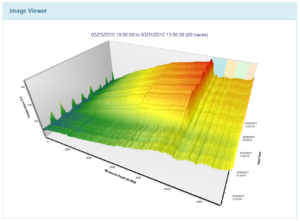
Having imported the data, the application manages data security and access to both human operators, using Tendeka’s FloQuest analysis and modeling software, and automated systems (Figure 4).
Furthermore, the system has an application programming interface (API) that offers a representational state transfer interface, which is the most widely accepted standard of software interoperability over internet-connected devices (Figure 5).
Results
The results from this solution have been impressive and, to date, multiple solutions with a similar or identical architecture have been deployed. The initial solution monitored 12 wells in Australia but has subsequently been scaled to monitor over 100, with another customer in South Asia utilizing the same solution and similar infrastructure. Obviously, each deployment changes depending upon the infrastructure needs of the well. Subsequent projects have been deployed using existing DTS vendors for the instrument boxes.
Over 5 billion measurement trace sets have been saved and analyzed.
System and Data Integrity
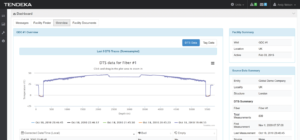
As the volume of data and the amount that one data set is dependent upon another increases, there is a greater risk of errant analysis or recommendations. Reputable vendors should perform a multitude of software and hardware testing to verify the accuracy of the data being generated by their instruments. It is equally important that operators perform field-level system integration testing as devices and systems are rolled out. There are various methods available to validate data, from a cyclic redundancy check, a software technique to detect errors in digital data, to hardware protocol handshaking and validation (Figure 6).
Simple data errors can typically be attributed to human errors at the time of deployment. For instance, a time stamp is frequently misunderstood for its complexity in software engineering.
Deploying a dedicated computer system in the field requires specialist industrial-grade equipment to survive the hostile conditions and must be certified for fire/explosion and chemical risks associated with the location.
Computer equipment and devices can be more susceptible to power fluctuation and outages. When computers are saving data to media, a power failure or flux can cause the data to be corrupted or lost completely if it isn’t correctly designed or configured. An intelligent device should communicate that it has lost power and provide status information that it is back online and if there are any issues with it due to the power loss.
The challenge when dealing with power outages is ensuring the system can self-start without human intervention once power is restored. The design of these automated restart capabilities must consider any potential safety hazards that may be created by re-energizing the systems.
Data Structure, Standards and Synchronization
Interoperability with different systems can be one of the most complex areas of dealing with digital data, as each vendor and organization has its own requirements and preferred standards.
Most vendors capture data from their devices and store it internally in a format that makes the most economical use of the system, and in a way that aligns with the products’ capabilities. Beyond this, vendors normally provide a mechanism to extract the data, either through a user interface or separate application, or through an API where interoperability issues may arise.
Joint industry entities, such as the World Wide Web Consortium and Energistics, have evolved to produce a set of standards and guidelines that let vendors exchange data by conforming to a common understanding of how the data should be structured and created.
When different systems conform to the same standard, the risk of data errors is significantly reduced. However, when two different levels of standards are being utilized, there is always the potential for both errors and omission in data.
Structured databases are typically the medium of choice for storing and accessing data. Choosing the right database has a direct impact on how the data is stored, retrieved and how other applications interface to it.
As data moves through the organization, ownership of that data may be transferred from one party to another, and with ownership comes the inevitable security concerns. The concept of data provenance – the tracking of the movement, editing and ownership of the data – is important in maintaining the traceability and integrity of the data.
As more data is captured and more workflows become automated, there is a greater reliance on the system to operate effectively and accurately in real time or near real time with zero tolerance for mistakes.
Likewise, planning for obsolescence should be a proactive strategy within the organization. Constantly analyzing the data infrastructure can determine when items are approaching end of use and can drive adoption of newer technologies before the old system expires.
The Future of Digital Oilfield Technologies
As computing power improves and IoT devices become smarter, the truly digital oilfield comes closer to reality. Individual solutions have the potential to expose data to new systems that can leverage that data and make it more valuable.
The ability to manage data automatically and process it by handling it at source and then bringing it into a cloud-based solution means that more data can be processed to its potential value. The same methodologies can be used beyond just DTS data. DC


