NOV rig census shows global rig market entering expansion cycle
Onshore, tightness of top-tier rigs will drive new rig orders, upgrades; offshore drilling growing modestly, but oversupply to sustain pressure on fleet utilization
By Carlos Huerta, National Oilwell Varco
As rig demand grows across land markets and offshore drilling recovers from its cyclical bottom, the industry will look to reactivate, upgrade and add rigs to suit market requirements.

Although all rig market segments saw improvements in drilling demand, the biggest adjustment took place on the supply side. In some regions, as many as 30% of rigs were removed from the available fleet for being inactive for more than three years.
US land rig demand in 2018 grew 11% to 1,209 rigs, compared with 1,089 units a year earlier. Canadian rig activity dropped by 6% to 194 rigs, down from 206 units in 2017. Rig supply in both countries fell sharply, with 738 fewer rigs (-27%) in the US and a 127-unit drop (-21%) in Canada compared with 2017. This resulted in 65% utilization in the US and 42% in Canada, up from 42% and 35%, respectively.
International land rig activity during the census period was estimated at 2,177 units. Overall utilization rose to 77%, from 71% in 2017, mainly due to 350 rigs no longer qualifying as available for census purposes due to prolonged inactivity. Some specific markets, especially within the Middle East and Asia Pacific regions, are essentially at full utilization and now require new rig orders to cover longer-term rig count growth.
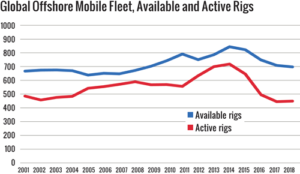
Global offshore rig demand bottomed out in the second half of 2017 and has been slowly improving since. During the 45-day census period, 452 offshore drilling rigs were active, and 700 units were available for work, for a 65% marketed utilization. This is an increase of 1% in active rigs and a reduction of 2% in the number of available rigs, compared with 2017. Some of the supply that is presently cold-stacked will likely be scrapped over the next few years as more capable units are still awaiting delivery at shipyards in Asia.
The available and active rig counts used for the census are calculated every year during a 45-day window in early summer. A rig is considered active if it was deployed at any point during the census window. Rigs are considered available if they have been active within the past three years for land rigs or five years for offshore rigs. Offshore rigs that are confirmed to be cold-stacked are subtracted from the available fleet but will be added back if the rig is marketed again.
Census Highlights
Key statistics from the 2018 census include:
• The US fleet, both land and offshore, had a net decrease of 738 rigs for a total of 1,952 available rigs. This change is the result of 818 rig deletions, offsetting a total of 80 rig additions (Figure 1).
• Utilization of the US fleet, combined land and offshore, rose to 65%, up from 20% at the bottom of the cycle in 2016 (Figure 2).
• The number of active global offshore mobile units rose by 1% to 452 units versus 448 in the previous census period.
• Overall international land rig utilization rose and now stands at 77%, up from 71% in 2017.
US Rig Attrition

An available rig is defined as one that is currently active or ready to drill without significant capital expenditure. To be considered available, a land unit must not have been stacked for longer than three years and five years for offshore rigs.
If it can be determined that a rig is cold-stacked, it is removed from the available fleet. Extensively damaged rigs are also taken out of the available count. Rigs that have moved to other countries are not counted as available in the US; however, they may show up in the international tally.
All rigs removed from the fleet in each of these cases are totaled as “Deletions to the US Fleet.” There were a total of 818 rig deletions this year, compared with last year’s 222-unit decline and a 10-year average of around 265 deletions per year (Table 1).
The largest number of deleted rigs continues to be in the “Removed from Service” category. This number jumped to 805 units in 2018, up from 215 in 2017. In the land segment, most of these removals came from rigs being inactive for more than three years. There were also a number of rigs that were sold at auction to international markets and sold for parts.
At least 11 land rigs in the US were taken to other countries since the last census. These rigs were transferred by their owners to work in their international fleets.

There were 22 new rigs delivered into the US market at the time of this year’s census. In land drilling, demand for new high-spec, pad-capable rigs is the driver for new orders, as some drillers have fully utilized their existing fleet and require newbuilds to meet future demand.
Offshore, most drillers are opting to high-grade select rigs to make them more attractive for future contracts. Certain market segments, like harsh-environment, North Sea-capable semisubmersibles, are highly utilized, incentivizing orders from drilling contractors that specialize in this region.

This year, additions (newbuilds and reactivations) were not able to offset the high number of deletions mentioned previously, resulting in the largest net decrease in the size of the US fleet for the past 13 years (Table 1).
The US demand for horizontal drilling currently exceeds the supply of the highest-spec drilling rigs. In addition to driving new rig orders, some of the larger contractors are working to upgrade some of their rigs to meet these requirements. Increased setback capacity, higher-torque top drives, walking systems and enhanced pipe-handling capabilities are amongst the most popular upgrades for the US domestic fleet.
Canadian Fleet

The Canadian available fleet dropped by 21% to 464 units during 2018. Most of these fleet deletions are associated with rigs that were never reactivated since being laid down at the beginning of the downturn in 2015.
Additionally, at least six rigs moved from Canada to US land drilling markets, including the Permian, as Canadian rig owners sought better returns for their assets. These movements out of country continued after the census period, adding at least three units at the time of this publication.
In contrast, four newbuilds entered the Canadian market in the past year, and 20 units were reactivated. This is about 50% of the normal cadence of additions in the past 13 years.
The net deletion of 127 units leaves the available Canadian fleet at its lowest level in 13 years. However, oil prices will have to move significantly higher to absorb all the available supply (Table 2).
Global Offshore Mobile Fleet
- Contractor-owned rigs belong to companies whose primary business is offering drilling contracting services.
- To be considered active, a rig must be drilling at least one day during the 45-day qualification period during the early summer each year.
- Only workable rotary rigs are included; cable tool rigs are excluded.
- To be considered as available, a rig must be able to go to work without requiring a significant capital expenditure.
- Rotary land rigs stacked for an extended period of time, typically three years or longer, are not counted as available. Offshore rigs must not be stacked for longer than five years.
- A rig must be capable of, and normally employed for, drilling deeper than 3,000 ft. Therefore, some shallow drilling rigs are excluded. This ensures well-servicing rigs are not counted.
- Electric rigs include all those that transmit power from prime movers to electrically driven equipment.
- Inland barges include barge-mounted rigs that may be moved from one location to another via canal, bayou or river and drill in sheltered inland waters.
- Offshore rigs include stationary platform units (both self-contained and tender-supported), bottom-supported mobile units and floating rigs (both drillships and semisubmersibles).
- The geographical breakdown for the NOV rig census is shown in Table 4.
Although offshore drilling seems to have turned a corner and is growing modestly since hitting bottom in 2017, the magnitude of the orderbook and the schedule of deliveries will continue to put substantial pressure on fleet utilization over the next few quarters. During the census period, fleet utilization rose slightly to 65%, following last year’s record low of 63%.
In this census period, a total of 29 rigs entered the fleet, up from 27 in the previous year and 25 in 2016. Forty rigs were retired from the fleet or were put into long-term stacking. Some of these cold-stacked assets may be reactivated when conditions improve, but some will remain sidelined and will eventually be demolished.
In aggregate, the available global offshore drilling fleet saw a net reduction of 11 rigs to a total of 700 rigs, and 452 units were active during the 45-day census period (Table 3).
If an offshore rig has not been active in the past five years and does not have a signed contract, it is removed from the available count until those conditions are met. This prevents rigs that cannot be quickly reactivated from being counted.
There were 24 new offshore rigs delivered in the past year, well below the average level of 40 units observed between 2009 and 2016. The main reason is that many offshore drillers are choosing to delay their delivery dates to reduce capital requirements and avoid having new assets sit idle on their fleet.
Rig owners are still actively looking to adjust supply to the current level of demand. Strategies being employed to reduce operating costs and provide support for dayrates include newbuild delivery delays, quicker cold-stacking decisions and accelerated retirement of aged and obsolete assets.
The worldwide offshore mobile fleet is widely distributed, with the Middle East, Northwest Europe and Southeast Asia accounting for nearly 50% of all active rigs during the census period (Figure 4). Figure 5 shows fleet composition and utilization by rig type.

US Activity

The methodology used to count active rigs for the NOV census is different from other published rig counts. The NOV census counts a rig as active if it has drilled at any time during a defined 45-day period in early summer. For 2018, the window of activity was 6 May through 20 June. Most other published rig counts look at weekly activity. Using a longer observation period ensures that active rigs in transit aren’t missed.
The number of active rigs in the US rose to 1,273 units during the 45-day census period in 2018, 14% higher than the number of rigs observed in early summer 2017. Overall US utilization rose to 65%, compared with 42% in 2017 and 20% in 2016. There were 679 available rigs in the US that were idle during this year’s census period. Most of these units are waiting for contracts. Census rules state that land rigs stacked more than three years and offshore rigs stacked more than five years are removed from the available fleet.
In the next edition of the census, overall utilization is expected to increase again as demand grows and most of the deletions associated with the 2015 downturn have already been processed.
Census results for the US are also calculated by region. The regional figures are a combination of land and offshore statistics. When looking at total US land rigs, utilization rose to 67%. The utilization rate was 41% in 2017. The US marine fleet utilization continued to drop in 2017 to 41% versus 62% last year.
Looking at the US land fleet in more detail, rigs can be compared by their drilling depth capacity. The largest rigs – those with depth capacity greater than 20,000 ft – had the highest utilization rate, at 85%, while those in the 3,000- to 5,999-ft range had the lowest utilization, at 29% (Table 5).
Canadian Activity
Year-to-year statistics for Canada have fluctuated with commodity prices and the timing of the spring thaw, when rig moving is restricted in environmentally sensitive areas. Canadian rig activity dropped by 6%, as the active count totaled 194 units during the 45-day window. However, utilization improved to 42% due to deletions in the available fleet and movement of rigs out of the country (Figure 6).
Segmenting the Canadian fleet by depth capacity, 60% of available rigs are rated between 10,000 and 15,999 ft, while 20% of units are rated beyond 16,000 ft. Utilization of the largest units is higher than those at the lower end of the size spectrum.
International Land Rig Utilization
The 2018 international land rig availability is estimated at 2,822 units, of which 2,177 were active during the census period (Table 6). This results in a global land rig utilization of 77%, higher than the observation of 71% in last year’s census.
Latin America was the region with the lowest land rig utilization, estimated at 72%. Venezuela is the only country in the region with falling rig activity. Argentina, Colombia and Mexico are seeing their utilization rates climb and will require the reactivation or ordering of new rigs to satisfy demand.
In Europe, low activity and a relatively low number of rigs in the region have kept utilization at 75%. It’s estimated that Russia, which is counted in the same category as Europe for census purposes, provides almost all of the rig count in the area, with Russian land rig utilization estimated at close to 80%.
For Africa, land rig utilization is estimated at 79%, having 75 active units and 95 rigs available for the purposes of this census. Algeria and Kenya are the strongest in terms of activity.
In the Asia Pacific, India and China are the strongest regions, with Australia coming in third place. Regional demand in the Asia Pacific, including China, is estimated at 78%, with a combined 700 active rigs during the census period.
Looking at the Middle East, the UAE, Kuwait and Qatar are essentially fully utilized, with Saudi Arabia running at 92% utilization. Drilling activity in the region remains stable, with upside potential once oil production cuts are eased.
US Industry Trends
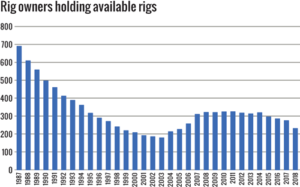
The number of individual rig owners holding available rigs is also quantified. For 2018, the number of rig owners is 231. Company closures, mergers and acquisitions, and large numbers of rigs being stacked all contributed to a net reduction of 44 companies this year (Figure 8).
In the 2018 census, drilling contractors owned 87% of all US drilling rigs, and operators owned the remaining 13%, roughly the same proportions as observed in 2017. As the market continues to tighten, some operators will likely consider acquiring their own rigs to ensure they can fulfill their drilling programs. As unconventional wells get deeper, land rigs in the Lower 48 are also expected to get bigger. The top decile of drilling activity will require more drawworks power, setback capacity and better in-pad moving features.
US Forecast for 2019
Drilling activity is expected to continue trending upward over the next year, although at a slower pace. Even when rig counts plateau in regions like the Permian, the fundamental tightness of top-tier land rigs will drive some level of new rig orders, as well as upgrades. It’s estimated that the market is most comfortable when utilization is in the 75-80% range for these high-spec rigs.
In terms of the size of the available US land fleet, retirement levels are expected to return to normal in next year’s census, as the effect of inactivity derived from the 2015 downturn has been fully recognized in 2018. Some reactivations are likely, especially in the case of highly capable electric rigs being upgraded from DC to AC power.
For offshore drilling, the recovery will come first in the ultra-deepwater market segment in the US Gulf of Mexico, although there will not be enough growth to require newbuild orders until early in the next decade. On the continental shelf, the large backlog of jackup deliveries will require more rigs to be scrapped in order to provide support for better dayrates.
In aggregate, a slower growth in US activity is expected until additional takeaway capacity in places like the Permian Basin come online late in 2019. Only moderate changes are expected for the next edition of this census. DC


