Statistical analysis helps to quantify benefits of new bit technology
Rather than rely on individual gut instinct, industry should look to trends from large-scale data sets to understand value and performance of new drill bits
By Chris Gooch, Ulterra
The drilling industry has relied too long on comparative experience and “gut instinct” when assessing new products and technologies and how they affect drilling performance. This is a problematic approach because applications vary wildly, even on the same pad or location, and no two wells are ever really drilled in the same way.
The holy grail of the drill bit segment is the like-for-like test, whereby the engineer will find the closest offset well comparison in terms of matching all the different factors that define an application. However, this is next to impossible to do because there are so many performance-influencing factors that cannot necessarily be controlled. Something as simple as a slight change in the interference fit of a mud motor, for example, could drastically change its ability to deliver torque.
Go big
The question that service providers should be asking is not so much whether one product is better than its competition or predecessor, but rather how to make sure that the comparisons being made are fair. As the industry moves toward more data-driven decision making, the solution to this issue appears to be to “go big.”

Large-scale testing and statistical analyses of the results is a rigorous method for correctly defining and quantifying product performance. It requires a significant number of runs of the product, as well as large volumes of offset data, but this is what the industry should strive for, rather than the quick fix like-for-like comparison.
Ulterra decided to use statistical analysis techniques on a large-scale data set to quantify actual performance improvements brought about by its RipSaw drill bits. One of the target applications for this technology is the 12 ¼-in. vertical intermediate section being drilled in West Texas, recognized by the industry as one of the biggest transitional drilling challenges. The company queried its bit run database for 12 ¼-in. runs in this application in the past 180 days, discovering 3,264 runs from 2,147 wells with 128 different operators, and more than 11 million ft of hole drilled.
Ulterra had already embarked on a testing program for the new line of bits, so this data set included 434 runs and 1.8 million ft of drilled hole with the technology, ensuring that results of queries were statistically significant.
Different conclusions
Starting with a data set this big, it was necessary to approach the analysis from a different angle than the typical performance metrics. The focus of the overall analysis was spotting trends within the data set, rather than analyzing individual runs. Engineers at Ulterra experimented with various techniques, including resurrecting an old roller cone bit performance analysis and applying it to a PDC bit application.
One of the key aspects of this application is whether a bit will run all the way from shoe to section TD in one run. Approximately one-third to three-quarters of the way through the section, operators encounter the Cherry and Brushy Canyon formations that are well known for causing damage to PDC cutting structures due to interfacial severity. Statistics show that about one-third of all runs do not make it through this part of the section.
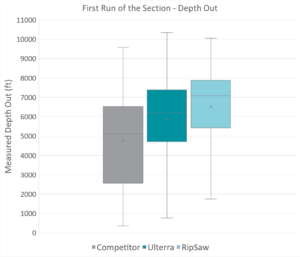
The first runs out of the shoe were isolated in the data set, and a risk profile chart was created that described the statistical chances that the bit would hit any given distance. The results showed that the new bit had an 80% chance of reaching 5,150 ft measured depth, compared with 50% for a competitor product. A box and whisker chart of the same filtered data showed that a lower-quartile run for the new bit would be an upper quartile run for almost any other bit type.

Another approach used was to draw the same risk profile graph but using total energy as the performance metric, measured in million pound-revs. This is a sum of the total revolutions applied to the bit while on bottom, multiplied by the weight on bit. This technique was used for roller cone bits to predict the reliability of their bearings. Considering the instance of failed bearings in a data set, different metrics had to be used for fixed cutter PDC bits. The data set was filtered for bits where the dull condition indicated that they were at the end of their usable life, with severe damage preventing repair or wear down to the blade top. This described a measure of the total energy that a bit design would be able to withstand before it had to be pulled out of the hole. It was found that the new bit had a higher chance of absorbing more energy before failure.
Efficiency gains
With approximately half of the US rig fleet concentrated in the Permian Basin, even small performance gain can mean massive monetary savings. Using statistical analysis, Ulterra was able to demonstrate and quantify the gains achieved by its drill bit technology. By applying the calculated cost-per-foot saving for the 434 new-bit runs in this study, total savings was found to be more than $74 million, or just over $171,000 per well. DC
RipSaw is a trademark of Ulterra.


