Low-force shear adds value to today’s BOPs
Study of shear mechanics finds shear geometry that reduces forces needed to cut tubulars
By Frank Springett, Eric Ensley and Darrin Yenzer, National Oilwell Varco; Scott Weaver, Noble Drilling Corp
With the increased use of stronger and tougher tubulars in today’s well construction, the ability to shear in the blowout preventer (BOP) without turning to larger operators is an economic necessity. Existing rigs need to drill with the high-performance steel available today without having to grow the size of the BOP.This article discusses the mechanics of shear and how it applies to V-shear technology and low-force shear. The latter provides the technology to extend the capabilities of present-day BOPs through improvements in shear ram design.
Low-force shears substantially reduce the forces needed to cut tubulars. Lower forces mean that both stronger and larger-diameter tubulars can be managed with the same shear operators, adding value to the existing stack and saving the contractor a major outlay for increased BOP capabilities and corresponding handling equipment upgrades.
Low-force shear technology is based on the philosophy of final shear area reduction. Getting more of the cross-sectional area cut prior to the final shear reduces the forces required in that final shear by leaving a smaller remainder cross-sectional area to be cut. By puncturing the tubular first and managing the design of the sheared material (chip management), the low-force shear begins effectively cutting material earlier and farther before reaching the final-shear section.
As the development of the low-force shear is optimized for various diameters, material properties and cross-sectional areas, opportunities expand to increase the range and variety of items in the wellbore that can be cut that were not previously thought possible. This capability would greatly increase the security of the well. The future frontier is “shearing more.”
Background
Historically, the industry has addressed the challenge of shearing bigger and tougher tubulars with bigger and tougher cylinders. The impact of larger and higher-pressure cylinders is more weight, more accumulator bottles and an overall larger system. In contrast, another approach is to look at the efficiency of the mechanism doing the shearing to reduce the force required to shear. With a more efficient system, the BOP can either shear existing requirements with smaller operators or shear more with the same operator.
In 2006, a project was undertaken aimed at reducing the total force required to shear. At that time, the project was intended to help the land market reduce the sizes of BOP and BOP operators – shrinking the weight and size of the BOPs and control system that have to be handled regularly. The structure of the project was set up with the primary goals of:
• Shearing the following tubulars at 2,500 psi or less with a 15 ¼-in. operator – the current operator size of a 13 5/8-in., 10,000-psi BOP:
o 5 7/8-in., 26.3 lb/ft with 165-ksi ULT and 80 to 100 Charpy. The estimated shear pressure with CVX V-shear is 3,800 psi.
o 6 5/8-in., 25.2 lb/ft with 165-ksi ULT and 80 to 100 Charpy. The estimated shear pressure with CVX V-shear is 3,700 psi.
• Accurate shear prediction. There have been many discrepancies in shear forces for essentially the same drill pipe with the apparent same material properties. The intent was to develop an accurate shear prediction model, as well as determine the root cause of these inconsistencies.
On top of these primary goals, the challenge goal was to shear tooljoints.
Phase 1: Learning, The Mechanics of Shear
Drill Pipe History
During the 1990s, the force required to shear S-135 drill pipe increased steadily despite the yield and ultimate strengths of drill pipe material staying constant, or in some cases going down. Analysis of sheared drill pipe properties determined that the primary contributing factor to this phenomenon was likely the toughness of the material, which is measured by a Charpy impact test.
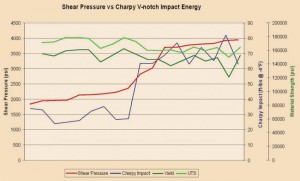
Figure 1 shows the correlation between changes in the shear force (red line) to the change in ultimate and yield strengths (green lines) and the Charpy impact value (blue line). The shear force plot follows the Charpy value plot, which is a clear demonstration of why shear forces have gone up over time despite a decrease in material strength. So why was toughness increasing?
The higher toughness characteristics in drill pipe was driven by an effort to lower drill pipe failures, such as the Shell SQAIR spec in the 1990s. Drilling tubulars with higher Charpy values are preferred because, in the instance of a crack, drilling fluid leaks through the crack before the drillstring breaks. This can be detected by the driller via a reduction in standpipe pressure. Tripping out is a much preferred activity to a complicated fishing job.
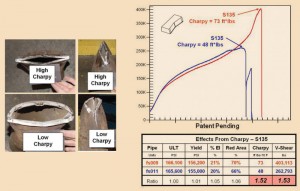
Historical data is fairly convincing, especially when looking at the maximum shear force required to shear; however peak shear force tells only a part of the story. Figures 2a and 2b show the process of shearing in its entirety, with photographs of the sheared specimen for each. FS009 and FS011 are two of the same types of drill pipe with nearly identical ultimate and yield strengths, percent elongation and reduction in area properties. The only notable difference in material property is the Charpy impact value, which is 50% higher for FS009 (red curve). The peak shear force for this specimen is also 50% higher.
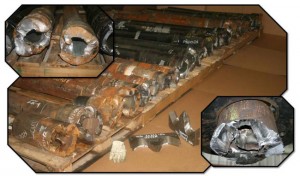
As can be seen from the photographs of the cut fish, the high-Charpy pipe was tough enough to completely deform to the shape of the shear rams, and once completely deformed, the shear rams cut through the entire cross-section of the pipe.
With FS011 (blue curve), the pipe deformed up to the point where it brittly broke. Typically the industry measures the performance of a shear ram by looking only at its peak force required to shear. Further analysis of the entire shearing process offered a better ability to dissect the mechanics of shear, and in turn, determine how to make it more efficient.
V-Shear Blade Geometry
The project team set out to learn about the mechanics of shear and the effect of blade geometry relative to shear efficiency. A comprehensive study with more than 500 shear tests was performed and included studies of:
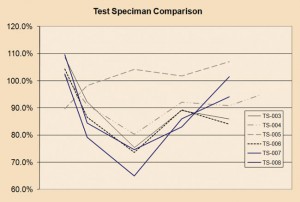
• Drill pipe geometry – With current V-shears, the thicker the wall, the more the drill pipe exhibits brittle fracture behavior, despite having high Charpy values. This is demonstrated by the thicker wall tube from specimen TS-005 in Figure 3.
• Blade geometry – Over 40 block designs were tested with varying blade angle, face height and rake dimension in an attempt to optimize shear force. This optimized V-shape geometry resulted in a 30% reduction in shear force. Figure 3 shows variations in pipe geometry (the TS reference numbers) to variations in blade geometry (X-axis).
• Friction – Shear tests were performed on lubricated and non-lubricated pipe to see if friction would affect shear efficiency. It was determined that friction had little to no impact. Through this testing, it was possible to see a 30% improvement in shear force through empirical improvements. However, while these gains were good, they were not the kind of step-change improvement desired. The project continued to investigate other geometries outside the V-shape blade to see if further improvements were possible.
Phase 2: A Step Back
After obtaining a better understanding the mechanics of V-shear, 22 different design concepts were developed and tested. The designs looked at everything out of the ordinary. No shape was rejected, and all were tested. Through this additional testing, the low-force shear was identified as the best performing geometry. This particular design punctures the tubular and demonstrated the most significant improvements.
The difference between this geometry and a V-shaped geometry is that the puncture shear cuts through only the thickness of the material at one time; whereas V-shears cut the entire cross section essentially at the same time, thus the high shear force at the end of the shear process. A good analogy of the low-force shear is a pair of scissors and how the blades cut along the thickness of paper.
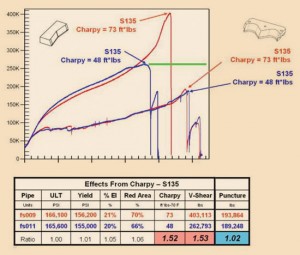
Figure 4 shows the shear plots for the same drill pipe specimens as Figure 1. Note that the force required to shear is approximately half of the force on FS009 for the high-Charpy pipe. The other item to note is that the low-force shear is not impacted by the different Charpy values of the specimens. The force required to shear is only a function of the material strength, blade geometry and tubular geometry. This is a significant finding – and one that will enable drill pipe manufacturers to continue to push the limits on drill pipe materials.
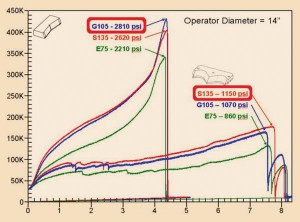
Figure 5 shows three different grades of 5-in. drill pipe and their associated shear plots. With the V-shear, the G105 pipe sheared at a higher pressure than the S-135 pipe, which interestingly indicates that the G-105 specimen was tougher (higher Charpy) than the S-135 pipe. This shows how sensitive V-shear geometry is to pipe toughness. The low-force shear values are significantly lower, and the shear force is directly proportional to the material strength only.
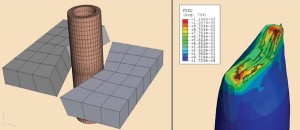
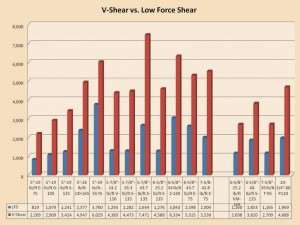
Figure 6 shows the peak force required to shear a range of drilling tubulars. The tests on the right side of the graph show the comparison between the V-shear geometry and the low-force shear for small-bore BOPs. The left side of the graph shows the same information but on the large-bore geometry. As can be seen, the improvements are significant. The thinner the wall thickness, the better the low-force shear performs – in some cases providing up to a six-fold improvement. For very thick pipe, low-force shear requires roughly half the force to shear.
Looking back to the primary objectives set out at the beginning of the project, the original goal was to shear at 2,500 psi or less with a 15 1/4-in. operator (the current operator size of a 13 5/8-in. 10,000-psi BOP) the following tubulars. Not only was the actual pressure almost half the goal of 2,500 psi, but it was also achieved on a smaller 14-in. operator. The CVX V-shear versus low-force shear values are:
• 5 7/8-in., 26.3 lb/ft with 165-ksi ULT and 80-100 Charpy: CVX V-shear = 4,473 psi, and low-force shear = 1,282 psi.
• 6 5/8-in., 25.2 lb/ft with 165-ksi ULT and 80-100 Charpy: CVX V-shear = 4,588 psi, and low-force shear = 1,276 psi.
Shear prediction
The other primary goal of the project was to develop an accurate shear prediction model. Once the effect of Charpy on shear values was determined, the project team went back to the Distortion Energy Theory using ultimate instead of yield strength. The formula is:
Shear Force = Ultimate Strength x 0.577 x Cross-Sectional Area
When applying this formula to the peak shear force, it was found that the formula was accurate when dealing with high-Charpy pipe, but the force predicted on low-Charpy pipe was considerably higher than the actual shear force.
From the discussion in Phase 1, the root cause of the phenomenon is evident. Therefore, when shear force is predicted with V-shear blade geometry, the worst case with regard to Charpy is assumed, and the actual shear pressures are lower than that value.
FEA analysis
One of the analysis tools used to help predict tubular failure was a complex finite element analysis. To successfully perform this type of analysis, many unconventional test specimens were manufactured and tested to determine the exact failure modes of the material. These test results were then input into the FEA model. With that information, the software was able to accurately predict the shear force, deformation and failure modes of the material. Figure 7 shows the stress plots and model meshing for one of the analysis runs.
Phase 3: Tooljoints
In May 2010, efforts to develop tooljoint shears were amplified. The objective was to shear 6-in. full-hole API connections, hardbanding, and be able to fit the shears in the current 18 3/4-in. 15,000-psi NXT BOP cavity. Using the same analytical methods used to develop the existing low-force shear technology, the ShearMax tooljoint blade was developed. The same types of shear plots were used, and a greater understanding of all phases of the shearing process enabled shearing of almost all tooljoint connections reliably with the diameter and pressure rating as exists today on subsea BOPs, 22-in. operators rated to 5,000 psi.
Current capacity
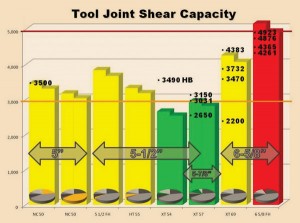
The results of present capabilities are illustrated in Figure 8. Each bar is a drill pipe size and connection type and size. The pie graphs reflect research conducted on the field population of these sized pipes for 5 in. and above. The black points with numbers are actual shears performed to date, and the bar graphs are the calculated values for estimated shear pressures.
All bars in green require less than 3,000 psi to shear, yellow are between 3,000 psi and 4,500 psi, and red is anything above 4,500 psi. Initial shear blade geometry has not been 100% successful cutting 6 5/8-in. tooljoints. However, there has been more success with the newer geometry in development. Before stating a connection can be cut (yellow or green), the shear pressure needs to be less than 4,600 psi and the success rate at 100%.
Hardbanding
The issue with shearing hardbanding is that hardbanding is well… very hard. The strengths of some of the existing hardbanding in industry today exceed 250 ksi. The initial hope was that the softer tooljoint material would deform below the hardbanding and brittly break.
However, the ultra-strong material is also extraordinarily tough. That, coupled with the reality that tooljoints material is pushing 160 UTS, has made finding a blade material capable of shearing those combined materials a challenge.
However, all is not lost. Currently, a formulation of shearable hardbanding is under development. Initial testing has successfully sheared a formulation of this new hardband design; however, more work is required with the development to ensure its suitability as a hardband material.
Conclusion
Previously unexplainable variability in shear values of similar strength drill pipe has given the perception of shearing being a black art. However, after thorough study of the mechanics of shear, it is now easy to explain these discrepancies.
With this added knowledge, one can now look at how shear geometry efficiency is improved, which results in two options. First is to shear the same tubulars that have always been sheared with smaller equipment. The second is to push the limits of what can be sheared with existing equipment.
With the newfound focus on the ability to shear tubulars, technology gains that provide for these substantial shear pressure reductions will only enhance the safety and capabilities of the world’s BOPs for years to come. Once the frontier of hardbanding is breached and a system of matched shears and tubulars are paired effectively, the next level of drilling security will be attained.
Acknowledgment: We would like to thank Noble Drilling Corp for their assistance with equipment and support to perform some of this testing.
Reference: US Patent 7,367,396 – Blow Out Preventers and Methods of Use – Low-force Shear Patent.
This article is based on IADC/SPE 140365, “Low-force Shear Rams: the Future is More,” presented at the 2011 IADC/SPE Drilling Conference & Exhibition, 1 – 3 March, Amsterdam, The Netherlands.


