JIP rethinks BOP leak detection for deepwater
Group develops digital solution providing validation within minutes
By C Mark Franklin and Rick Cully, IPT Global; Tim Sargent, Noble Energy; Charles Brown, Hamilton Engineering; Gary W Owen, Devon Energy; Steven Griffith, Shell; Jerry Osmond, Hess Corp; Tore Grønås, Statoil

To advance the technology of BOP leak detection through a software development initiative, operators, service providers and drilling contractors established an industry consortium in early 2009. The initial development focused on the testing of BOPs in deepwater.
Through an iterative and collaborative process, a solution for low-pressure (LP) and high-pressure (HP) BOP testing has been developed. For example, due to the constraints and subjective nature of the current circular chart recorder (CCR) methodology for validating a test, a small leak may not be identified for up to 30 minutes into the HP test. With this new methodology, objective identification of a slow leak typically occurs during the LP portion of the test in less than three minutes, and a good test (no leak) typically validates in the regulatory agency’s minimum holding time requirements.
Additionally, the software provides greater assurances, transparency and reliability compared with the CCR.
This article discusses the current state of the development along with the associated benefits. A vision of the application development pipeline for further pressure analysis opportunities is also introduced.
Background
As the industry moves into deeper waters using non-water-based fluids, the challenges associated with obtaining effective pressure tests continue to grow. Historically, digital pressure measurement solutions had not been considered due to its accuracy. Prevailing interpretations of regulatory requirements to “hold pressure” were to demonstrate a flat line on a pressure chart for a specified period of time. With the relatively low resolution of a CCR device, a flat line was essentially produced when the resolution of the device was exceeded (typically 4-6 psi). Analog chart recorders had the additional “benefit” of allowing excessive damping and manipulation without recording such settings or actions.
The accuracy of digital solutions showed that pressure typically decayed for a long period of time, requiring an excessive amount of time to stabilize and “flatten” for the required holding time. This pressure decay was a result of thermal influences.

The industry consortium believed the CCR needed to be replaced with a digital solution. It was acknowledged that the new methodology must use digital accuracy and implement an analysis methodology that would take into consideration the scientific cause of pressure decay and would use this information constructively in test analysis and system verification.
Joint Industry Project Cooperation
During 2009 and 2010, four operators, along with the support of several service providers and drilling contractors, participated in a JIP. The main goal was to develop state-of-the-art leak detection with best practices for testing BOPs in deepwater.
The JIP was broken into two phases. Phase I gathered digital data from BOP tests performed in the Gulf of Mexico (GOM) and around the world. Archive data was used as test data, and a library of over 100 data sets was built. Review of the results showed that each data set had between 10 to 25 tests, 86% of which represented passing tests.
Over the course of data analysis, it was found that there was significant variability in conditions under which tests were conducted and validated. With respect to the psi per minute pressure change during the last five minutes of a test, commonly referred to as the flat line, the range was from 4 psi/min to over 20 psi/min.
The data archives provided insight into an automated approach for validating deepwater BOP pressure tests. A software prototype was developed along with workflow automation features, which was refined through multiple design review meetings with the JIP members and the US Bureau of Ocean Energy Management, Regulation and Enforcement (BOEMRE).
In preparation for field trials, the prototype software was enhanced by building in connectivity, an enhanced user interface for workflow management, and comprehensive reporting capability. Phase one was completed when the software became ready for field trials.

Phase II, field trial installations, commenced on five deepwater rigs in the GOM. The software was also run in the background in a real-time operation center during BOP and manifold testing from multiple rig types (deepwater, TLP and jackup). The goal of Phase II was to work out software issues, including obtaining feedback from the end users for optimizing the value and ease of use of the software package.
During Phase II, the software operations manual was developed, along with the formal leak detection certification training. A comprehensive submittal document was prepared that chronicled the application development activities and included a risk assessment. Phase II was completed when the JIP members and the BOEMRE approved the technology for use.
Also during Phase II, the scope of the development expanded. Rig person following observations were made:
- Understanding system response requires consideration of the context of the leak test with respect to the fluids, pressure and volume of the system.
- Inconsistency in test execution procedures creates ambiguity; consistency in procedures provides clarity.
- Combining consideration of context with test procedure consistency is a key factor in effective leak detection.
These points must be addressed thoroughly in training and education to maximize the effectiveness of the leak detection methodology.
Software Demonstration and Field Leak Simulation
The introduction of any new tool, whether it is mechanical in nature or software, is going to be met with skepticism in the field. It is common to hear, “We have done it this way forever, why do we need something new?” or “That will never work.” Well-documented factors leading to human resistance to change include a natural skepticism until a change is proven.
Training and demonstration proved critical in converting the skeptic into an advocate by showing that the product was truly viable. It also provided the basis for understanding the development and increased comfort and confidence with the application. The goals stated in training were to create a safer, more efficient verification of BOP equipment. This made the purpose and agenda of the application very clear, particularly in light of newly emphasized importance on BOP equipment verification following the 2010 Macondo incident. Also, any importance previously placed on subjectively interpreting a paper chart was likely to be less desirable after understanding the application and its benefits.
Once training was completed, an actual leak demonstration on the rig was often another step for validating the new tool, as performed in the following scenario. The rig was operating in 5,300 ft of water. Three 5,000-psi tests were performed down the choke line against closed fail-safe valves at the BOP. The software ran as though conducting an actual test sequence with all participants involved.
The first test was conducted as the benchmark test. The second test was validated in five minutes. Once the third test was validated as a non-leaking test, a leak was initiated at the choke manifold. Out of the total system volume of 105 bbl, less than 6 oz was bled back when the software confirmed a leak. With this demonstration, the rig personnel were convinced of the tool’s value, as the leak was not detected on the CCR.
Application evolution, Program Development
Software Application Development and Influences

Modern cement units (CU) typically provide instrumentation and measurements for pressure, rate and volume. Such data are readily available from CU system control apparatus in an easily usable form (delimited text or WITS standard formats). Because the CU is used to create the pressure for BOP and manifold tests, this data availability has enabled the development and implementation of a software-based solution.
The analysis components developed during Phase I of the JIP were embedded into an application where user interaction, ease of use, workflow management, and presentation of results were considered and implemented. Parameters controlling the digital analysis and passing criteria for all tests defaulted to values consistent with prevailing US Code of Federal Regulations (2009).
Refinements made to the application throughout the initial adoption period included report enhancements, documentation of failed LP tests, the recording and reporting of BOP functional tests, and the introduction of pressure-only tests for BOP stump tests.
Leak Detection Training and Education Opportunity
The foregoing analysis of data led to a wealth of BOP testing facts and information, including:
- Further understanding of pressure increasing during the LP test.
- Additional analysis and understanding of HP test pressure response.
- Understanding the pressure variation response due to inconsistent pressuring methods.
- The real (negative) impact of “bumping” pressure during a test.
- The impact of fluid circulation.
- The correlation of pressure changes between systems under test.
- The limitations and issues related to the CCR.

This information was organized and used to develop the industry’s first in-depth training on BOP leak-detection fundamentals, techniques, procedures and best practices. The benefits of this education included increased safety and awareness, improved problem detection and isolation skills, and greater overall testing efficiency.
Software Features
Rig and Well-site data capture
The application allows critical rig and well-site information to be captured and retained for all tests at the site. This information is included in each test report.
Workflow Management
BOP test procedures are set up and retained for all tests and include the test description, required pressures and benchmark group. Once tests are under way, the application automatically follows the test sequence, requiring interaction only to change sequence, add comments, or to pause or complete the test. Ease of use
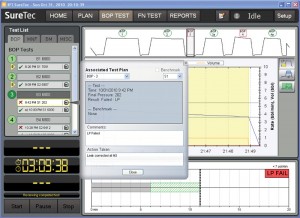
Much attention has been placed on user interface and interaction of the application. Figure 3 illustrates the design and application components. Figure 4 shows the clear presentation of a failed LP input form.
Meaningful Results
The application produces test results that are logically organized, enable quick identification of results, and provide detailed information on each test including test progression, comments explaining results and a clear depiction of pressure, rate and volume for each test. A final set of charts depicts pressure in a presentation similar to a CCR but with rate and volume information, automatic test designators and a full history of events.
Connectivity
The Windows-based application currently supports serial (RS-232) and network-based connectivity for its data feed. Remote monitoring through terminal service applications has been used.
Regulatory compliance

The application provides workflow, test requirements and documentation to support regulatory compliance of the US Code of Federal Regulations through:
- Documentation of the intended test plan and sequence.
- Guided completion of the test plan.
- Documentation of comments and action taken for failed test attempts.
- Full recording of the pressure, rate and volume history of the entire test on a digital chart.
- Parameters control of the objective measurement and criteria of test pressures and hold-time durations.
- Passing of LP tests before HP analysis will be performed for each test.
Test archive and retrieval
All tests are stored in binary and PDF file formats and are protected by tamper-proof signatures and certificates. All local test history is available for review and further scrutiny. Test files are easily transported or replicated, and any installed version of the application can be used to retrieve and review test results.
Leak simulation and case histories (leak simulator)
The application was subjected to thorough testing of existing test data, as well as engineered test scenarios. A tool was developed to create test simulations to ensure broad coverage of all anticipated scenarios of pressure decay, noise and leak rates. Figure 5 shows an example of the data and leak simulator tool.
Future Software Features
The application continues to evolve into an advanced pressure testing tool that replaces manual and/or CCR-based procedures.
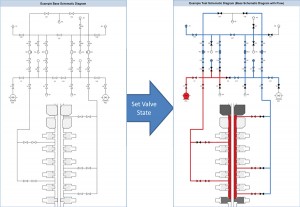
One suggestion was to include the ability to document BOP valve diagrams and associate valve states (open or closed) and corresponding pressure and leak paths with individual BOP tests. Properly planned and documented test plans are critical to efficient and comprehensive component tests. Clear documentation of test plans ensures test execution is properly followed and confirmed, as well as providing clear results for oversight verification. In practice, a great deal of variability existed in producing these documents, component graphic representation, flow path and component coverage reporting. Such variability and lack of standards needed to be addressed.
As a result, the software application is evolving to include the capability to represent graphically a rig’s BOP, manifold and test fixtures in a standard and consistent presentation or schematic. Test technicians can reference each test in a sequence to the schematic and include the valve alignment (open/closed status) as part of the test plan. With this information, the application can depict the intended pressure and leak path for each test step, providing a clear and consistent schematic along with the components tested for each step. Figure 6 provides a schematic and pressure/leak flow example.
Going forward, further development accommodating other pressure tests such as formation integrity, casing, negative in-flow and other tests is anticipated.
Summary and Technology Benefits
The following benefits were recognized because of the tests and participation:
- Objective leak detection: It was very difficult to detect small leaks on a CCR.
- Objective test validation: The user no longer had to guess at the subjective flat line.
- The need for frequent re-testing due to the subjective evaluation (or false negatives) was eliminated.
- The majority of leaks are now identified during the LP test.
- Digital archival of all aspects of the tests takes place.
- A volume record helped validate pressure test paths were properly lined up.
- Less exposure time for personnel and equipment to HP conditions increased safety.
- Real-time monitoring capability was provided.
- Test results cannot be manipulated.
- Ability to scrutinize tests, including pump data was provided.
- Reports were simple and clear in either PDF or IPT format.
- Leak detection and software competency training was provided – a first in the industry.
Conclusions
BOP leak detection tools and procedures based on thermal transforms and automated analysis improve leak detection accuracy and remove ambiguity and subjectivity from test result determination in field trials and production tests. BOP leak detection education and training increases operator knowledge and improves pressure testing procedures in efficiency, analysis and problem determination.
The net impact of these improvements is safer BOP testing practices, more accurate results, more comprehensive test reporting, and greater assurances and transparency.
This article is based on OTC 21688, “Advances and Impact of Software-Based Deepwater Blow Out Preventer (BOP) Testing,” Offshore Technology Conference, Houston, Texas, 2–5 May 2011.
Acknowledgments
The authors wish to thank the JIP members Devon Energy, Hess, Noble Energy and Shell for their commitment to making the industry safer and more efficient. The authors also want to express a big thank you to Capsher Technology and others for their insights and contributions that have made a difference.
References
1. Franklin, C.M., Vargo, R.F., Sathuvali, U.B., Payne, M., “Advanced Analysis Identifies Greater Efficiency for Testing BOPs in Deep Water,” SPE/IADC 87155, 2004 IADC/SPE Drilling Conference, Dallas, 2-4 March.
2. Schuler, PsyD., A.J., “Overcoming Resistance to Change: Top Ten Reasons for Change Resistance,” www.schulersolutions.com/html/resistance_to_change.html. Downloaded 27 October 2010.
3. US Code of Federal Regulations (CFR) 30 PART 250 – 2009. Oil and Gas and Sulfur Operations in the Outer Continental Shelf. Subparts 447, 448, 449, 450, 451, 516, 616 and 617.


