Speech recognition technology adapted for high-accuracy detection of drillstring breakover
Patterson-UTI leverages machine learning technology commonly used in other industries to create flexible automation solution

By Stephen Forrester, Contributor
Technology continues to evolve, permeating nearly every corner of human life. Oil and gas, which employs some of the most advanced systems on the planet, is one industry where technology plays an outsized role in operational success. When thinking of oil and gas, however, the systems powering Siri, Apple’s digital assistant, probably do not come to mind. At this year’s IADC/SPE International Drilling Conference, however, Patterson-UTI’s Data Science Manager, Alex Groh, discussed just that: how speech recognition technology is being used to detect drillstring breakover and optimize drilling tasks.
Mr Groh began the discussion by asking attendees a rhetorical question: What do Siri, DNA sequencing, solar irradiance modeling and electrical discharge modeling all have in common? The answer, he said, is the methodology used to solve a frequent problem during drilling: detecting drillstring breakover or when the entirety of the drillstring is moving.
“Drillstring breakover is the process by which we start the bit after they’re picking up or slacking off,” Mr Groh explained. “So, when you pick up your bit off the bottom during a connection, your weight to slip means you’re going up and then you’re going to set slips later.”
Because the bit doesn’t move right away, there’s compression in the drillstring — and it takes a certain amount of distance, typically referred to as the pipe squat, before the bit actually starts moving. In fact, the bit does not move at all until the hookload reaches what is referred to as the breakover weight, which is usually higher than the steady-state weight that occurs after. The reason?
“When you pull, you have a little bit of extra static friction in the wellbore that you have to overcome before you convert everything to kinetic friction and everything is stable,” Mr Groh said.
Detecting this phenomenon is important for two reasons. First, if the user employs a simple algorithm and averages all the hookload values in this pickup process, drag in the well will be miscalculated. As such, it is important to detect breakover accurately to obtain the correct values.
The second reason is to optimize connection practices. Mr Groh noted that he works with several operators that have expressed curiosity about picking up the bit and guaranteeing that the bit is moved off bottom before performing a tare. Problematically, this desire can lead to overzealousness in terms of the distance that the operator is picking up.
“We have one operator that wanted to have 20-ft pickup distances to guarantee breakover, especially in very, very deep laterals — around 25,000 ft,” Mr Groh said. “But you don’t necessarily need to pick up that distance every single time across the well, which is why our objective in this study was to be able to detect breakover in real time.” Additionally, Patterson-UTI wanted to integrate this capability into automation systems, he continued.
The study began by using simple logical techniques to detect breakover before switching to a more rigorous approach founded in data science. The team collected 200-millisecond data — five hertz from five rigs across several basins — to obtain a holistic representation of behaviors across the rig fleet. Then, in partnership with subject matter experts, they manually labeled more than 400 instances of breakover for both pickup and slackoff. The labeling project was exhaustive, but ensuring high-quality data at the onset was critical.
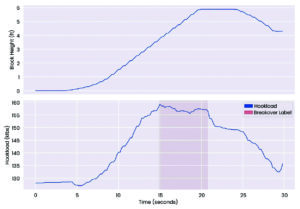
Mr Groh explained their findings in the figure at right, which shows block height versus time in seconds, with a shaded portion over the graph designated as the new SME-developed breakover label. “The intent was to have an algorithm that detected that shaded area, showing that we indeed have broken over,” he said. “Then, we can use that to return it to a control system for automation and other types of data capture.”
Through their work, the team discovered that axial stiffness correlated well with pre- and post-breakover states. “Axial stiffness is a very intuitive quantity,” Mr Groh remarked. “If you were to take a rolling average of your hookload over the rolling average of your block height chain in the same region, you’d get an approximation of what’s effectively a spring constant. And when you look at that, you can use it to detect breakover.”
This spring constant is quite simple, he said, adding that axial stiffness decreases as the drillstring gets longer — what would be expected from a spring. When the length of the drillstring is doubled, it effectively halves the spring constant, which is what Mr Groh saw when plotting this over depth. Accordingly, it requires greater distance and force to break over the deeper the drillstring is in the well. This comes full circle with pipe squat and both the length of the string and the amount of drag, or the amplified effects of static friction, in the system.
An important consideration was that simply taking the derivative of hookload with respect to time was not a good approach, as some motions comprised multiple speeds. Using just the hookload derivative without normalizing the distance traveled would be challenging precisely because it relied on speed, while axial stiffness makes speed irrelevant.
Once Mr Groh and the team had this feature identified, they needed to determine what to do with it — specifically, what machine learning model was needed to reliably select pre- and post-breakover states. Fortunately, this was the exact type of problem that Hidden Markov Models (HMMs) — a technology that has been used in speech recognition systems like Siri, DNA sequencing, astrophysics and electrical engineering — were designed to solve.
An HMM is a statistical model that describes the probabilistic relationship between a sequence of observations and a sequence of hidden states. It can be used to predict future observations or classify sequences based on the underlying hidden process that generates the data.
Mr Groh attempted to explain this in a simpler way: “An HMM is a really, really useful piece where, effectively, if you have a given state in your time series data, these models are able to divvy up different states and detect them for you. With something like Siri, what they do is they’ll take a look at the frequency spectrum of voice coming into the speaker or the phone. Then, based on the distribution of those sounds, they’ll classify them as syllables and words. We’re going to take a much simpler approach, but it’s fundamentally the same methodology.”
For this scenario, an HMM was trained to follow the output distributions of calculated axial stiffness with learned transition probabilities. The data set was randomly separated into training and testing sets by pickup/slackoff motion, with the training routine for the algorithm involving sequences of axial stiffness values over time being passed to an HMM configured to learn two states. Via other algorithms, the HMM could learn different state representations independently without those states being labeled. Once it did, it could then be applied to incoming hookload data to predict the possibility of being in pre- or post-breakover, forming the basis of the remaining model as an input feature that can be taught to predict a final breakover state.
Mr Groh next examined how the model progresses by separating data into pre- and post-breakover states before determining a definite probability of being broken over. “We use bagging and principal component analysis (PCA) to help the algorithm figure out what’s happening,” he noted. “Bagging makes it so that you can combine several separately trained HMMs and produce a much better model. We train these HMMs and reduce some of the output, and then we have a final classifier that gives you a probability of breakover. So, we’re finally at the end where we have a probability at every single point in time whether we’ve broken over.”
The final model architecture adhered to the following procedure:
1. Collect incoming hookload and block height data
2. Calculate axial stiffness
3. Pass axial stiffness values to HMMs for state probabilities
4. Further refine/reduce output possibilities with PCA
5. Use Extreme Gradient Boosting, an algorithm for supervised learning, to compute breakover possibility
6. Smooth results and generate final breakover state
This model was deployed to Patterson-UTI’s rig fleet utilizing on-location computing infrastructure. This circumvented the need for an internet connection between the rig and computational infrastructure and allowed the model’s results to be sent to the driller or rig control system.
The overall accuracy of the model exceeded expectations, with breakover detected correctly 90% of the time on the test data set. Precision, or a measure of the fraction of instances that were indeed post-breakover when detected, was 90%. Recall, or a measure of the fraction of true breakover instances that were detected, was 98%.
With such a high recall rate, the model detected the overwhelming majority of breakover events that occurred, all within roughly 1-3 seconds — at or above the abilities of a human operator.
Opportunities for application
Mr Groh elaborated on three opportunities to apply the model: torque and drag monitoring, automatic weight on bit (WOB) and differential pressure taring, and connection time optimization. He explained that automating torque and drag monitoring is not a new concept, but using the model improves overall data quality and reliability. Traditional data sources rely on the driller to manually identify steady-state weight and provide it in a daily report or in the electronic drilling recorder — an inconsistent, error-prone method.
Taring — the process by which a reference value is chosen for measuring WOB or differential pressure — is typically performed by returning to bottom after a drilling connection, using hookload and standpipe pressure values just prior to tagging bottom as references to calculate WOB and differential pressure. Though this method works in vertical well sections, in deep lateral sections its conditions are not often met. Using the model can allow for values to be tared prior to making a connection, in turn significantly reducing the noise seen with pre-connection slackoff hookload while still following the overall trend that post-connection, tag-bottom hookload provides. The HMM facilitates successful taring here by providing all the relevant outputs for an automation system.
For connection time optimization, Mr Groh referenced his earlier comment about operators wanting to have a higher pickup distance. “I already mentioned that some operators want to have a high pickup distance, especially on their weight system side when they’re connecting, just to guarantee that the bit is broken over,” he said. “This is obviously a great application of the model because if we know the bit is broken over, we don’t have to worry about it; you simply use this algorithm to pick out the point where you’re done picking up and you return back and go.”
Reducing the pickup distance enabled almost 20-second time savings per stand — which doubles to almost 40 seconds per stand when accounting for time slacking off prior to connection.
Mr Groh concluded by reflecting on the early success of HMMs for Patterson-UTI and expressing his hope for continued evolution in how the technology is used.
“HMMs have been really powerful for us,” he said. “We were able to integrate the model into some of the control systems, and we’re undergoing testing for that now. We’ve deployed it across the entire fleet, at least for just data generation, so every single unit in our fleet now has automated torque and drag data that’s generated across every trip and every stand that we drill. We’re looking forward to many other cases that we can potentially apply the model to — anything that involves state detection. It would be very simple.” DC
For more information, please see IADC/SPE 217717, “Speech Recognition Technology Used to Detect Drillstring Breakover and Optimize Drilling Tasks,” presented at the 2024 IADC/SPE International Drilling Conference, 5-7 March 2024, Galveston, Texas.