Integration of knowledge, experience make for effective relief well contingency planning

Response plan, complexity assessments must incorporate knowledge on blowouts, well construction, hydraulic modeling, kill planning, P&A
By John Wright, Wild Well Control

When do we drill relief wells to control a blowout? If there are no other practical options, the answer is “almost always.” Relief wells are the last line of defense when surface or subsea control is not possible. Historic examples include: the blowout wellhead is lost to a broach and crater; the blowout is located in a congested wellbay on an offshore platform with little horizontal and vertical access; a subsea wellhead is bent, preventing subsea capping; there is a high H2S safety risk; or surface intervention has a high risk of escalating the blowout consequence.
Of course, many relief wells are started in parallel to surface control operations but are terminated or redirected as a replacement well if the surface operation is successful. Sometimes the relief well is used to assist with plug and abandonment if surface options are blocked by mechanical obstructions, collapsed casing or some other lack of access to the wellhead.
The current generation of relief well contingency planning started after the successful completion of the Saga Petroleum 2/4-14 relief well offshore Norway in 1989. These plans have since evolved primarily from the experience of relief well specialists who have designed and managed the non-routine services required to intersect and hydraulically kill dozens of blowouts using a relief well.
In the aftermath of the 2010 blowout in the Gulf of Mexico, there was an immediate response from the industry to build and deploy subsea cap-and-contain systems on a worldwide basis. Now that these systems are entering a mature development stage, many operators have recognized the importance of relief well planning and are shifting their focus to this last line of defense.
Many regulators are now requiring a relief well plan prior to approving an application for permit to drill. This is a positive proactive step; however, most engineers tasked with implementing these objectives in their companies have no experience in relief well design, and useful public domain references on the subject are limited and often subjective, so they seek outside support.
Planning a successful relief well to control a blowout is a system design that requires the integration of blowout knowledge, well construction, hydraulic modeling, kill plan design, and plug and abandonment through a relief well. Experience in all of these fields is critical to success.
The focus of this article is to improve the industry’s understanding of relief well design and provide at least a minimum required scope of work for an adequate plan. This is based on more than 30 years of expertise from relief well specialists in the Wild Well Control Relief Well Group, who have collectively used the described procedures in the successful design and construction of 72 relief well intersections around the world.
What is a relief well contingency plan?
A relief well contingency plan (RWCP) is a nebulous term used generically around the industry for a number of different types of response plans and blowout control studies and will mean different things to different people. This lack of industry standard requires that operators prepare contingency plans that are very specific with respect to scope of work and deliverables when using the services of contractors who might assist with preparing the plans.
For the purposes of this article, an RWCP is specific to an operating area. It is a subset of all incident emergency response plans (ERP) and well control emergency response plan (WCERP) and has the following hierarchy:
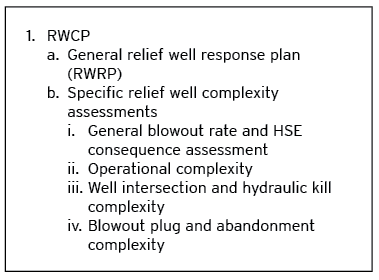
An RWCP is divided into two distinct parts. The first part deals with how an operator will manage a blowout control operation using a relief well and is called an RWRP. Typically, there is only one response plan for an operating area, and it would be updated periodically based on changing circumstances. The second part of the RWCP is to assess how complex it may be to use a relief well to regain control of a blowout on a specific well in the area defined by the response plan. This assessment may include: 1) blowout rate and consequence assessment 2) operational complexity 3) kill and well intersection complexity, and 4) blowout well plug and abandonment from the relief well complexity.
Part 1: general relief well response plan
The objective of the response plan is to quickly activate an organization that can demonstrate “command and control” of a blowout control operation in the eyes of the public, regulators, shareholders, personnel, partners, insurance underwriters and contractors. All operators should have an RWRP specific to each of its operating areas. It should contain, as a minimum, the following components:

The contents of this plan should be concise, consisting primarily of flowcharts and checklists that can be easily printed and handed out to individual team members. The objective is to assist the operating company’s drilling engineers – who in all probability have never been involved in a blowout control operation – to start gathering data and begin planning immediately after a blowout how they will integrate with relief well specialists with the detail planning and execution. The planning process for a real relief well has different aspects than used when conducting a complexity assessment for a contingency plan.
Part 2: specific relief well complexity assessments
The objective of this assessment is to: 1) predefine the complexity (degree of difficulty based on key variables); and 2) estimate the time to construct a relief well and regain control of a blowout for any well in the area covered by the relief well response plan. The completion of this task should also be confirmed and audited for non-operating partnerships wherein the operator has exposure.
The results of the assessments can be used by the operator as follows:

If an operator has a large number of varied assets with different issues, then a number of well- and site-specific plans will be required to assure the objective is met. It may not be required to perform the complete assessment on every well. Wells with common issues, e.g., kill hydraulics on a platform, might be grouped together using a representative (most difficult) single well assessed as an example for the common group.
The basic assessment process is outlined in Figure 2.
Engineers tasked with developing relief contingency plans for their operating areas should collaborate with relief well specialists and critical service providers to define tiers of relief well complexity based on certain quantifiable parameters. This can be applied to general operations (e.g., logistics, rigs, equipment, personnel, security, HSE, drilling problems, time to construct well, etc.); kill hydraulic requirements (e.g., kill mud density, rate, volume, location, equipment, etc.); well intersection requirements (e.g., surface location, difficult trajectory to drill, ranging difficulty, depth, temperature, formations, hydraulic communication method); and blowout well plug and abandonment complexity.
The results of this tiered system will make it much easier for management to verify their potential exposure, to what extent the consequence has been mitigated by the existing RWCP, and what, if any, further mitigation is justified.

This article is based on a presentation at the 2014 IADC Well Control Europe Conference & Exhibition, 2-3 December in Aberdeen.