Predictive system helps wells adapt to changing formation pressures
System works with MPD to induce pressure oscillations, keep average wellbore pressure constant
By Brian Piccolo, Pat Savage, Henry Pinkstone and Christian Leuchtenberg, MPO
To proactively determine the downhole pressure limits necessary in managed pressure drilling (MPD) applications, Managed Pressure Operations (MPO) developed a pressure determination system (PDS) called Predictive Driller. The system, which is expected to undergo initial field testing this year on a tender-assist drilling rig, progresses MPD to a system that can anticipate and compensate for changing formation pore and fracture pressure margins as well depth increases.
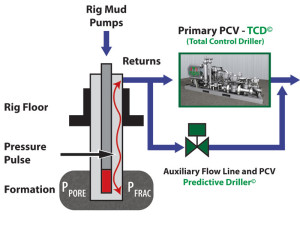
The PDS is deployed in conjunction with an advanced MPD pressure-control manifold using pressure-control valves (PCV), a rotating or non-rotating annular sealing device and a return flow rate metering system (Figure 1). The PDS is based on the premise that an additional small-bore PCV, positioned in parallel with a larger-bore MPD PCV, can oscillate with a programmed open/close cycling speed to generate a pressure pulse wave in the annulus. The programmed small PDS PCV thus produces an annular “pulse” with parameters specified by the MPD operator within the PDS control system.
As cyclic annular pressure changes occur, the models and algorithms within the PDS analyze the relationship between the return flow rate meter and bottomhole pressure (BHP) to determine if pore or fracture pressure margins are changing. If either is breached, the PDS readjusts the target BHP to remain within the new drilling window. Through this process, the average BHP is not expected to fall out of the drilling window. Wellbore compressibility of fluids, solids and gas, wellbore storage effects, and the efficacy of the pulse transmission are key factors to facilitate the PDS analysis. Further, since any potential drilling fluid losses or gains from the formation are driven by brief pressure pulses from the oscillating PCV, the resultant change in the volume of wellbore returns is negligible.
PDS concept
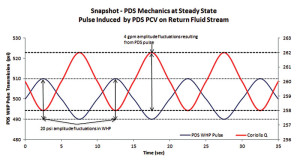
Three examples are given to explain the PDS concept, based on a wellbore that contains a single-phase, water-based drilling fluid. Figure 2 illustrates the wave mechanics of a continuous oscillation pattern of the PDS PCV between an open and closed flow orifice that produces a pressure pulse and the subsequent impacts on the behavior of BHP and return drilling fluid flow rate in the presence of constant formation pore and fracture pressures.
When the PDS PCV opening is increased, BHP is decreased, causing the return flow rate to increase due to wellbore storage effects. Conversely, when the PDS PCV orifice opening is decreased, BHP is increased, causing the flow rate to decrease. Over the time frame, illustrated in Figure 2, the BHP and return flow rate behavior from the generated pressure pulse in the wellbore remain homogenous and free of discontinuities as the pulse amplitude remains within the existing pore and fracture pressure boundaries.
Figure 3 represents an example where the fracture gradient is decreasing. As a result, the BHP pulse is exceeding the new formation fracture pressure while the average BHP remains within drilling margins. Under this circumstance, the BHP waveform begins to exhibit discontinuities at a point where the pressure pulse value exceeds the new fracture pressure.
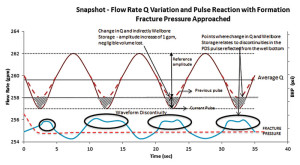
Consequently, the return flow rate measured by the return flow rate meter decreases. The drop in the return flow rate is now made up of both wellbore constituent compression from wellbore storage and a negligible amount of lost drilling fluid returns to the formation as the pressure pulse positive amplitude (i.e., the crest) momentarily exceeds the new fracture pressure. Under such circumstances, the PDS would calculate the pressure pulse value where the negligible fluid losses occurred to determine the new formation fracture pressure. Next, the PDS manipulates the main MPD PCV to reduce the average target BHP to a safe value within the new drilling window. This prevents significant lost drilling fluid returns.
Figure 4 represents an example where pore pressure is beginning to increase. Under this circumstance, the oscillating PDS PCV produces a pressure pulse with a preset amplitude value that causes the BHP to momentarily decrease below the increased pore pressure value. As the negative amplitude of the pressure pulse (i.e., the trough) decreases to below pore pressure, a negligible influx volume enters the wellbore, causing a brief increase in flow out of the annulus. This increase in flow rate is now driven by both the expansion in wellbore fluid from wellbore storage and the additional flow of a negligible volume of formation fluids during the momentary influx. Under such circumstances, the PDS would calculate the pressure pulse value where the negligible gains occurred to determine the new pore pressure. Next, the PDS manipulates the MPD PCV to increase the average target BHP to a safe value within the new drilling window and ultimately reduces the risk of taking a significant kick.
Wellbore storage factor
To determine the proximity of the BHP to a changing formation pore or fracture pressure as the wellbore is extended, the PDS analyzes the change in the return drilling fluid flow rate versus the change in BHP induced by the PDS PCV. This is referred to as the wellbore storage factor, Cws, and is one of the main effects governing the PDS.
The Cws may be reported in bbl/psi or cu m/Pa and is a function of the volume and compressibility of the drilling fluid and solid mixtures in the wellbore. By tracking Cws, the PDS can determine if there was any change in the return flow volume for a given change in the BHP. Variations will be compared with the expected Cws for the wellbore under static conditions (i.e., no changes in formation pore or fracture pressures), which will be calculated frequently as the well deepens, producing a “fingerprint” for the analysis.
The method of calculating Cws from the two-flow rates Q1 and Q2 (in bbl/min or cu m/sec) is:
Q1,2 (units are bbl/min or cu m/sec)
Equation 1
Vws= ∫ (Q2 – Q1) dt (units are bbl or cu m)
Equation 2
Cws= Vws/∆P (units are bbl/psi or cu m/Pa)
Q1,2 is the change in volumetric flow rate at the flow meter that occurs over the given time interval associated with a change in the applied surface backpressure (ASBP). Vws is the wellbore storage volume, which is the additional volume of fluid that can be “stored” or “released” from the annulus as a result of changes in the ASBP. ∆P is the incremental change in pressure imposed on the wellbore volume over the given time interval as the PDS PCV oscillates its orifice size.
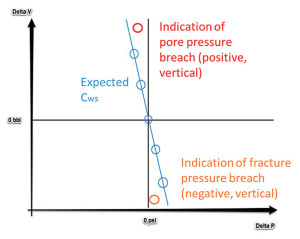
The wellbore storage effect may be tracked graphically (Figure 5). The Cws is represented by a change in the return flow volume on the y-axis and a change in the BHP on the x-axis. As such, changes in BHP and subsequent changes in the return flow volume are all expected to be on the same line, assuming that BHP is within drilling operational margins as shown in blue. It is expected that Cws data points will be plotted on the same line if the PDS pulses do not cause BHP to exceed drilling margins.
Pore pressure determination using Cws
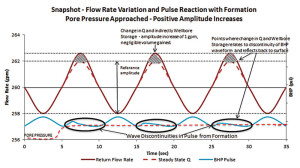
The PDS PCV oscillations that result in a Cws that deviates from the expected value may indicate that the formation pore pressure is changing. Figure 4 demonstrates that when the BHP decreases below the pore pressure margin, the pressure pulse waveform may exhibit signs of discontinuity or interference for a given PDS PCV size adjustment. Additionally, the return flow rate out of the wellbore increases beyond what was expected for a given PDS PCV size adjustment relative to Cws.
The red data point in Figure 5 demonstrates a deviation from the expected Cws slope in the positive, vertical direction, indicating that the flow rate out of the annulus has increased more than expected for a given BHP change. Once such a change in Cws is confirmed as statistically significant, the PDS will command the MPD PCV to close further to increase the BHP to above the new formation pore pressure value and within the new drilling margins. Thus, the risk of a significant influx is eliminated.
Fracture margin determination via Cws
The PDS PCV oscillations that result in a deviation from the expected Cws may also indicate that fracture pressure has been breached. When plotting this on the graph of expected Cws, the deviation from the expected Cws slope is negative, in the vertical direction, which is indicative of a lower volume of fluid flow returns than expected from a given change in BHP. An example of a plot demonstrating that the BHP has increased above the fracture pressure is shown in Figure 5 in orange. Once a change in Cws in the negative direction is confirmed as significant, the PDS will command the MPD PCV to open more to decrease the BHP to a value below the new formation fracture pressure value and within the new resultant drilling margins. Thus, the risk of significant lost returns is prevented.
Evaluating BHP
In the presence of continuous BHP data transmission, such as coiled tubing or wired drillstrings, PDS pressure pulse waveform behavior can be analyzed in real time at the well TD. This will help to determine its effects when it reacts with the formation pressure thresholds for determining the new pore or fracture pressure. It is predicted that real-time mud pulse telemetry and recorded memory data from mud pulse telemetry, including pressure while drilling (PWD) data, cannot practically be used with the PDS due to its data transmission rates.
If continuous BHP data transmission is not available, changes in BHP may be implied via changes in the ASBP. Since BHP is the sum of hydrostatic pressure, annular circulating friction and ASBP, a change in ASBP will directly impact BHP. The PDS will use a dynamic hydraulics fluid flow model to extrapolate the ASBP to an equivalent BHP.
However, the use of ASBP changes to determine BHP changes is complex due to lag time between adjusting the PDS PCV size and when the BHP is sensed at the bottom of the wellbore. This lag time will vary with the density, viscosity and volume of wellbore fluids and MD of the wellbore. As a result of lag time, PDS PCV oscillations would be need to be spaced out far enough that the resultant pulse behavior from an initial PDS PCV adjustment is not interrupted by the impacts of the following PDS PCV size adjustment and subsequent pulses.
Using this method, interference of successive PDS pressure pulses should be avoided, resulting in a more accurate analysis for each generated pulse.
Confirmation of fracture/fracture system
The PDS may be developed to determine the presence of a fracture or fracture system because of significant dampening of waveforms. If a high-permeability fracture or fracture system is encountered, the BHP and volumetric flow rate is expected to plateau following a PDS PCV orifice reduction. Steps may be taken to cure the fluid losses to the fracture to continue drilling safely. On this note, the PDS concept may be further developed to depth selection to conduct fracturing during completions.
Continuous circulation system and PDS
Temperature affects the compressibility of the drilling fluid system and may vary when the rig mud pumps are stopped and started. The temperature profile of the drilling fluid will vary over time as it exchanges heat with its environment, both the formation and riser on deepwater wells. With MPD continuous circulation systems, the average temperature profile of the wellbore may be held relatively constant during the drilling process. Stabilizing the wellbore temperature can facilitate a consistent Cws throughout a drilling operation, allowing for the PDS to more reliably indicate if drilling margins are being breached while oscillating wellbore pressure.
Despite the use of continuous circulation systems, changes in BHP may still be expected while making or breaking a drill pipe connection. For example, reducing drillstring rotation can cause a drop in BHP due to the elimination of traces of turbulent flow, resulting in a BHP drop during circulation. Additionally, continuing to circulate for extended periods without penetrating new formation can also cause a drop in BHP as the concentration of cuttings in the wellbore is reduced as the hole is cleaned. Although the lost BHP can be offset with an increase in ASBP from the MPD PCV, the transient variation in the pressure profile of the wellbore may skew the Cws. As a result, any analysis performed by the PDS with regards to a changing pore or fracture pressure should also consider the impacts of standard rig operations.
Field testing
Initial field testing is planned for the PDS system in 2014 on a tender assist drilling rig. The testing will focus on the system’s capability to effectively induce pressure pulses in the wellbore annulus and subsequently evaluate effects of wellbore storage and the resultant change in the behavior of return fluid flow rates. The testing will initially be conducted in casing prior to drilling out the casing shoe. An option to conduct testing while drilling out the casing shoe may also be used. Under these circumstances, the performance of the PDS can be evaluated during a change in solids content in the annulus.
Predictive Driller is copyrighted to Managed Pressure Operations.
This article is based on a presentation at the 2014 SPE/IADC Managed Pressure Drilling and Underbalanced Operations Conference, 8-9 April, Madrid, Spain.


